Frequency Magnitude Investigation
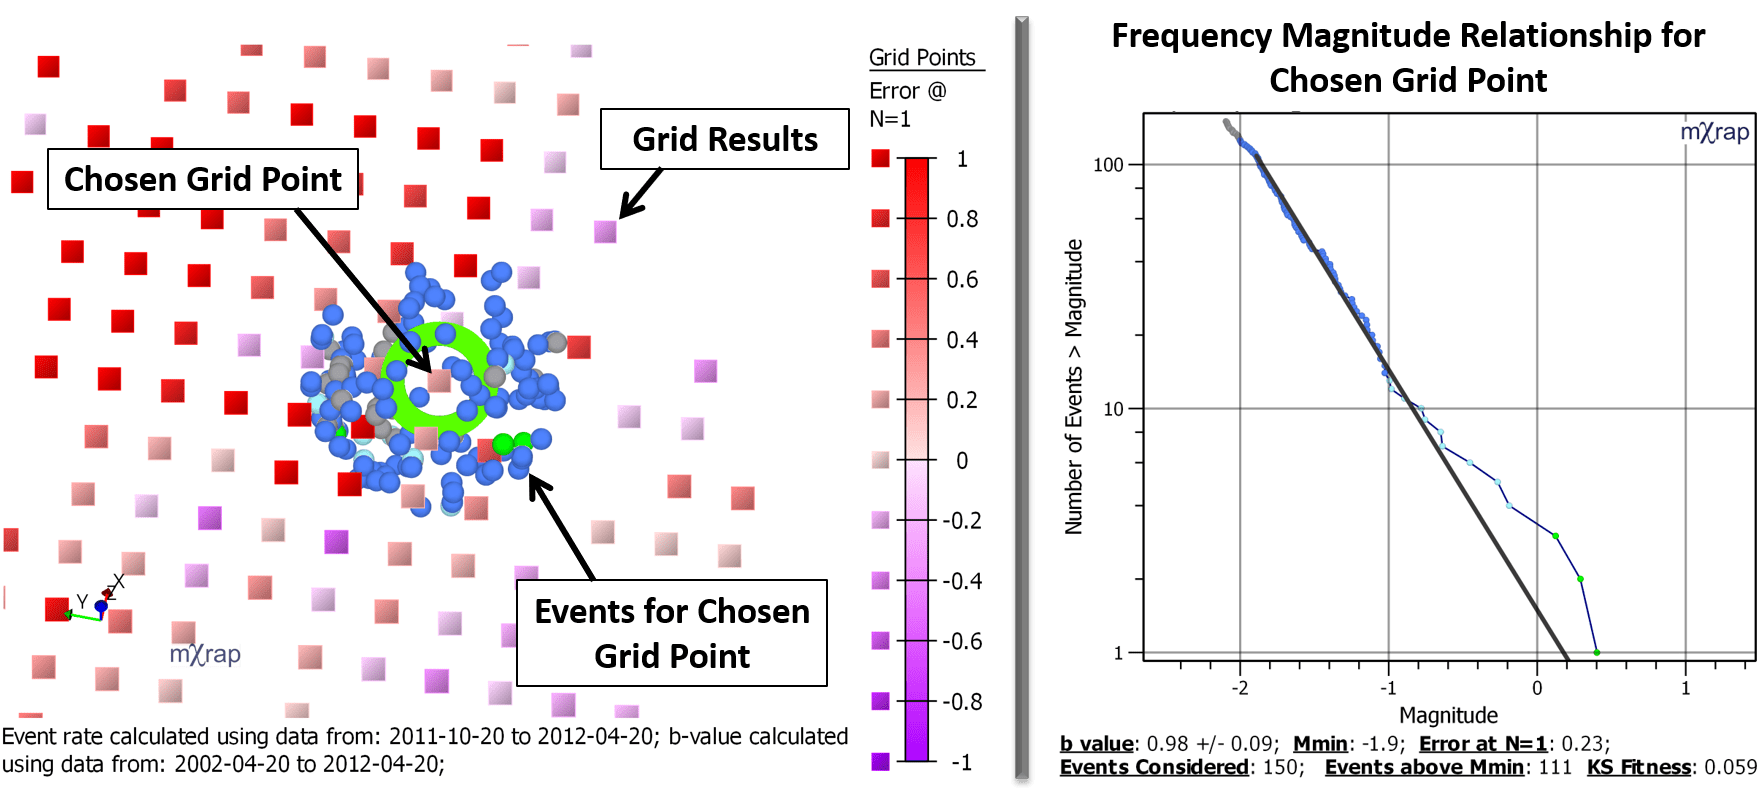
You can pick any grid cell to view the frequency magnitude chart of events found in the local area. This is the b-value used for this grid point. The b-value is a very sensitive parameter in hazard calculations, and there are cases where the automatic FM modelling algorithm may not work well. There are several markers to help identify potential areas where the FM model may not represent the data accurately:
- Mmin - the magnitude of completeness, above which all events are recorded.
- b-value Standard Error - b/√N@Mmin. Note: this does not describe the deviation of data from the FM model, but a measure of uncertainty in the b-value.
- Error at N = 1 - Crude goodness of fit measure, the difference between the largest event and the 'a/b' value. Note: it isn't necessarily an 'error' for there to be a difference here. The 'a/b' magnitude is the maximum likelihood for the largest event in the FM model, but the largest event has a wide distribution of possible magnitudes.
- KS Fitness - Kolmogorov-Smirnov goodness of fit measure, describing the probability that the data is a sample of the underlying FM model. The KS value itself is like the p-value in a null hypothesis test, i.e. the probability the data does not follow the distribution. A KS test below 0.05 would be good fit, 0.05-0.1 would be a mediocre fit, and above 0.1 would be a poor fit.
A few of the control parameters related to grid-based b-value calculations have been exposed in this window. Users can limit the potential range for the grid Mmin and define the search parameters for assigning events to each grid point:
- Rmax - The maximum distance to search for events around the grid point. No events outside this range will be used.
- Limit Search N - All events within the Rmin (Rmin = grid spacing) are assigned to the grid point. After that, increase the search radius until there are this many events or Rmax is reached. If more than this many events have been considered, it means there were more than this many events within Rmin. If less than this many events have been considered, it means Rmax was reached.
- Min N above Mmin - At least this many events must be above the Mmin of the grid point FM. If there are less events than this, no b-value and no hazard is assigned to this source.
There is also an extra quality check to ensure that events are representative of the local source, and not simply a result of an expanded radius into a separate source. A quality cut-off distance is used, where at least 10 events must be within this shorter radius of the grid point.
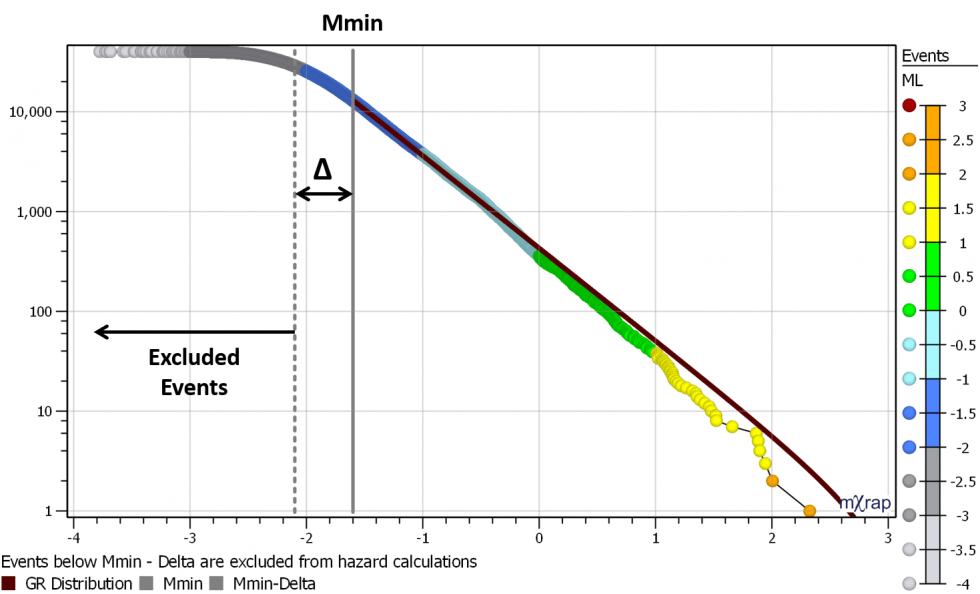
In the same window there is also a global frequency-magnitude chart. This uses all events before the backdate, throughout the whole mine. This shows the Mmin that is used for the event rate calculations. Events well below the global Mmin (Mmin - Δ) are also excluded from the b-value calculations. This is primarily to speed things up. The Δ parameter can be adjusted in the control panel but beware, it will affect the other search parameters. E.g. increasing Δ and including more small events means you will need to increase the search N to ensure you will still get the required number of events above Mmin.