Predicted Performance Analysis
This window is for sites that have prediction model and want to compare the predicted performance with the actual performance. The analysis is separated into per stope, per face, per octree and advance windows. They are all set up the same way with a filtering panel, charts on the left, 3D view on the right and tables at the bottom. The filtering panel holds some basic options for filtering extreme predictions and observations, the stope, face type and face tags.
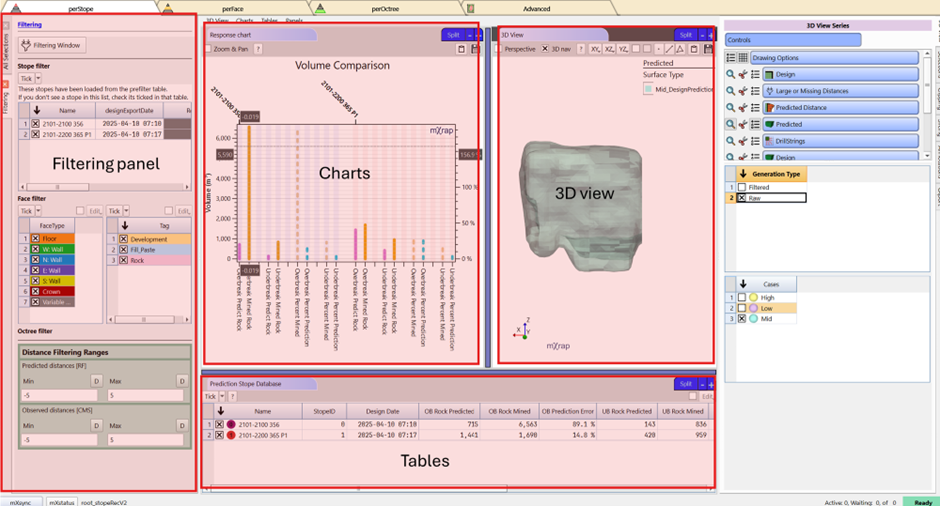
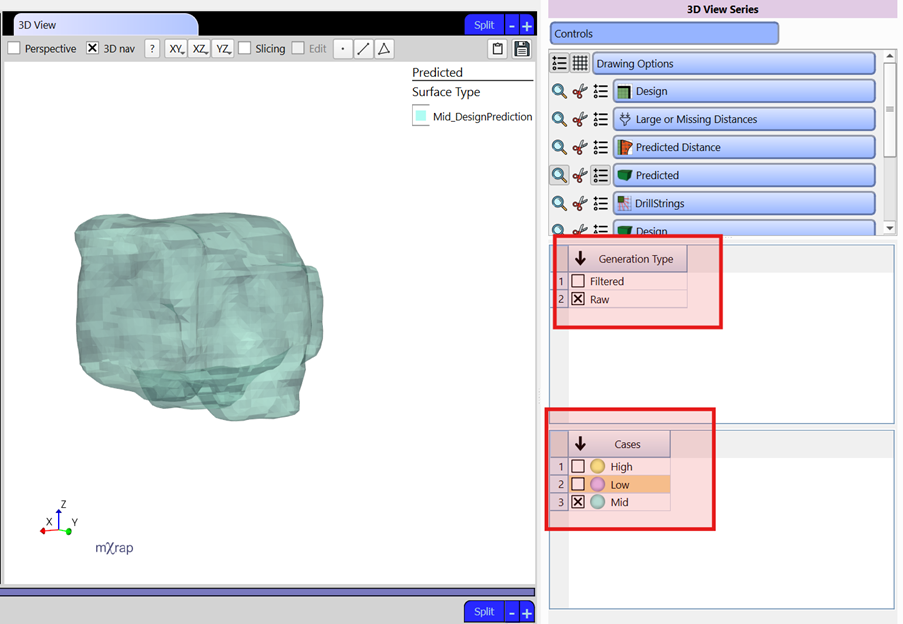
The 3D View is the same for all windows. Series include the octree intersecting the design, their projected distance, and large/missing distances. Surveys associated with each stope include drill strings, design, mined, faults, and development along with the convex hull. The predicted surface can also be displayed with option in the controls to plot alternative prediction intervals.
Per Stope
Purpose
Assessment of prediction error on a per stope basis. This is used to identify stopes where general predictions were accurate and provides a starting point to investigate the causes for less accurate predictions.
Analysis options specific to stope consist of:
- Volume comparison chart - A bar chart that plots the predictions and mined volumes for overbreak and underbreak.
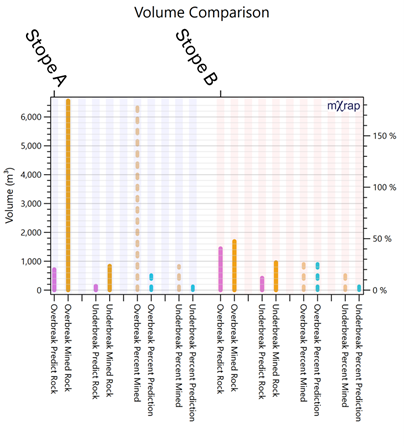
- A table summarizing the predictions and mined volumes along with percentage errors. Additional information includes The random forest model and prediction surface used
Per Face
Purpose
Assessment of prediction error on a per face basis. This is used to identify faces that are predicted accurately and provides a starting point to investigate the causes for less accurate predictions.
Analysis options specific to faces consist of:
- Volume comparison chart - A bar chart that plots the predictions and mined ELOS and ELLO per face.
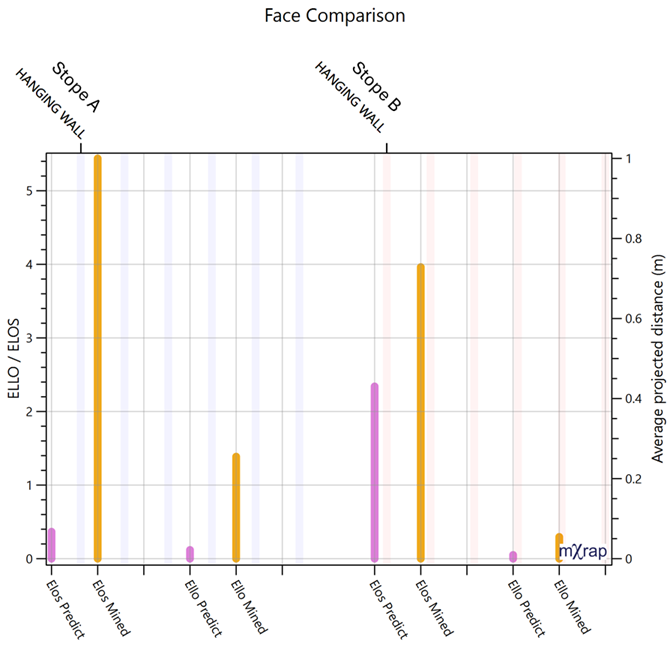
- A table summarizing the predictions and mined ELOS and ELLO along with percentage errors.
Per Octree
Purpose
Assessment of prediction error on a per octree basis. This is used to identify trends or groups of octrees that the model predicts with less accuracy. For example, octrees with large overbreak being under predicted. Additionally, this window may be used to evaluate the general quality of the model and its ability to correctly separate OB and UB.
Analysis options specific to octrees consist of:
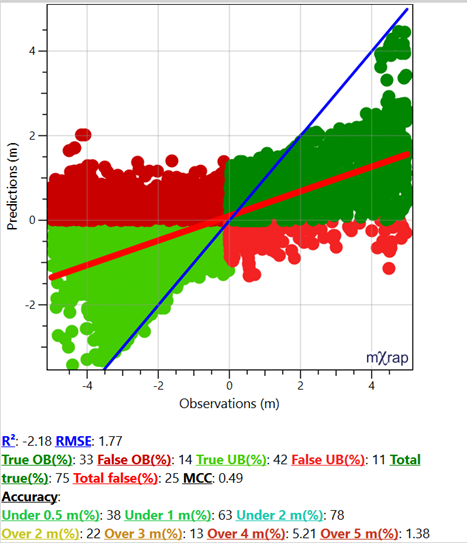
- Prediction vs Observation Chart - This plots the predicted and observed projected distance for each octree point. The chart footer provides statistics for the model's performance.
- 3D View - The octree design series and Predicted distance line series can be used to visualise the predicted and mined results per octree. Different markers can be used to visualise the data:
- Predicted distance (raw value, from surface reconciliation, standard error and prediction error)
- Projected distance from CMS
- Accuracy class marker (absolute prediction error)
- Prediction class marker (in regards to if OB is predicted as OB and UB as UB; Green means yes, Red means no)
Use the selection box to help with identifying areas with poor performance.
Advanced
Purpose
While similar to the per octree window, the advanced window includes additional tools to evaluate model performance. Additional charts such as the Response chart and SPE chart provide more in-depth insight into the model's prediction accuracy for specific octrees.
Analysis options specific to the advance window consist of:
- Prediction vs Observation Chart - See per octree
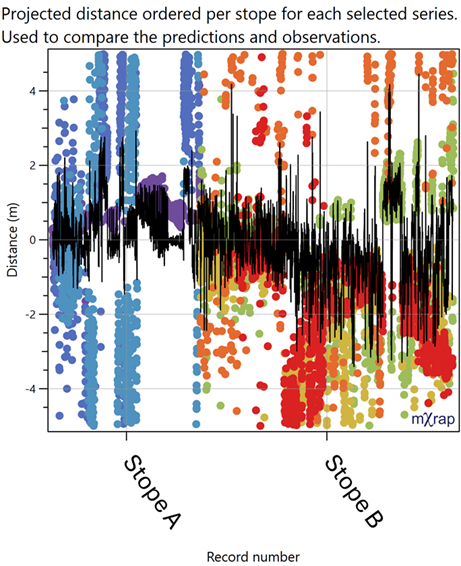
- Response chart - Used to compare the predictions and observations. Projected distance ordered per stope for each selected series (per octree, face, and stope)
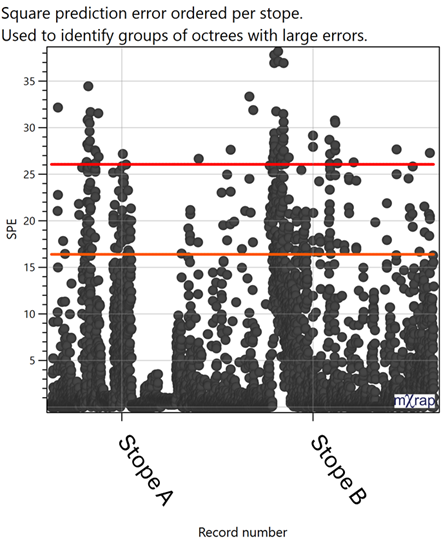
- SPE Chart - Square prediction error ordered per stope which is used to identify groups of octrees with large errors.
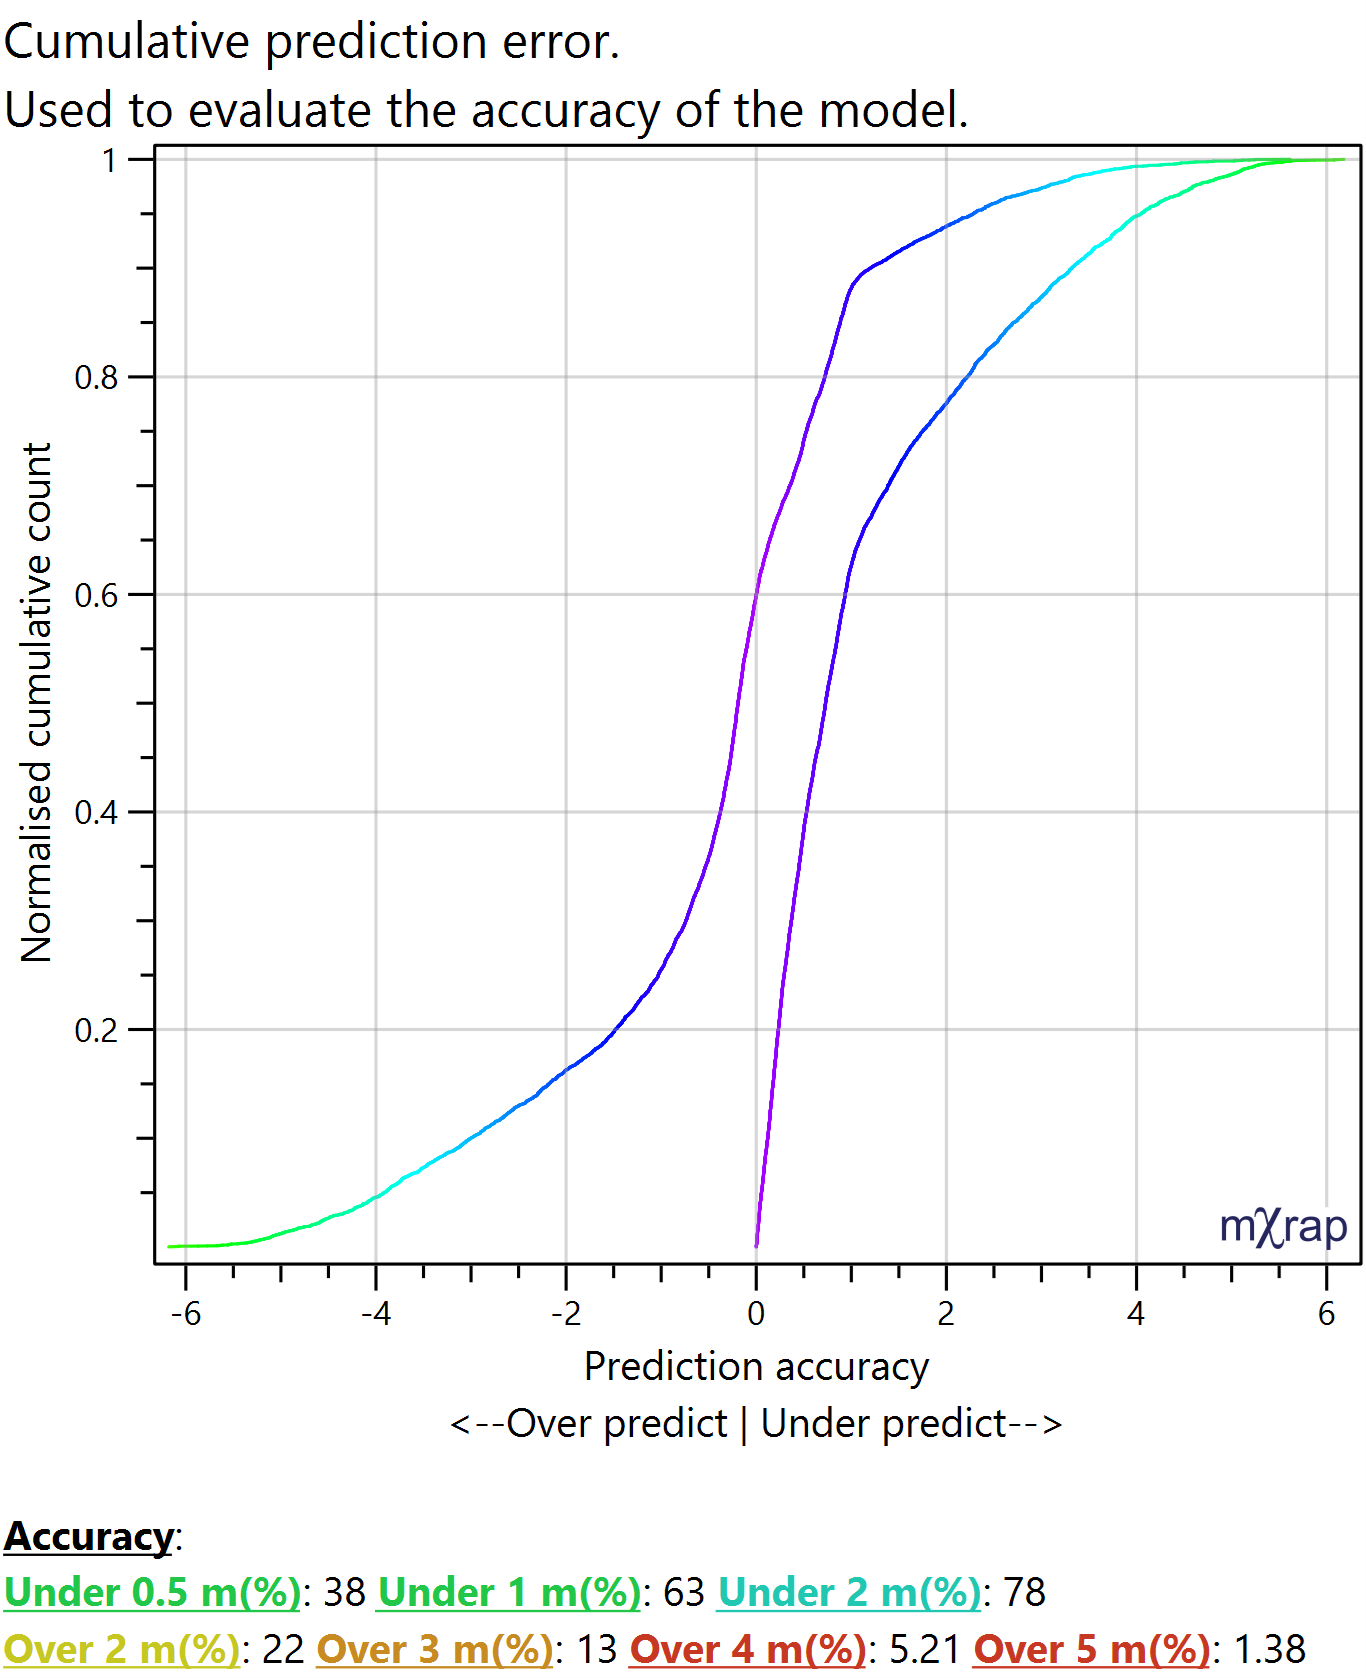
- Cumulative Chart - Cumulative prediction error which is used to evaluate the accuracy of the model.
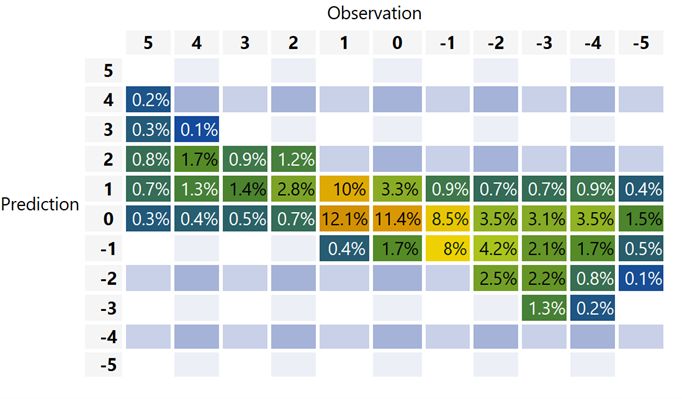
- Confusion matrix - A summary of what portion of the data set belongs to rounded combinations of observations and predictions. The diagonal represent an accurate prediction.
- Confusion matrix summary - Table that groups data by the rounded distance and prediction and provides positive-negative rates and true-false rates.