Distance to Survey
Charts
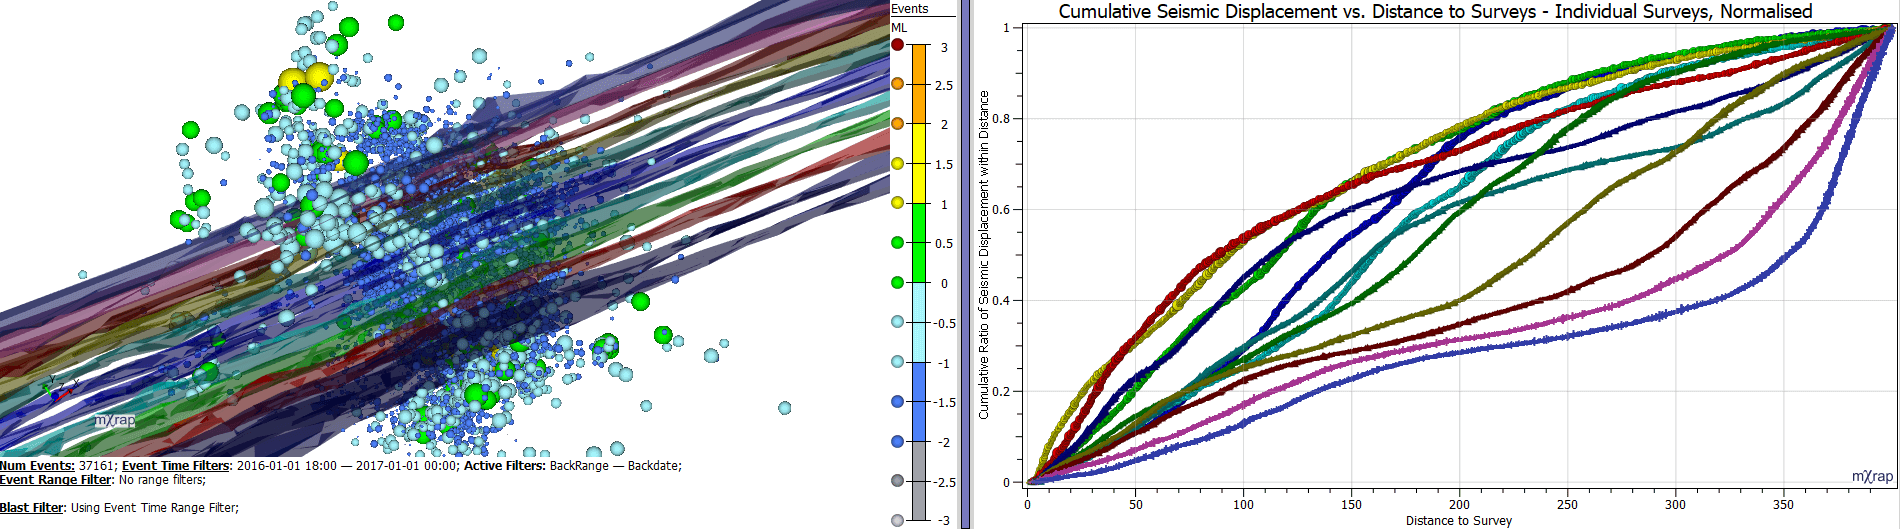
The distance to survey filter has been around for a while but now we have added a couple of new charts to further investigate the relationship between seismicity and your input surveys. The charts have been added to the General Analysis application, under the Charts menu - look for Distance to Surveys.
The example below shows how you can compare your seismicity around your geological structures. Of course, sometimes a structure will have a lot of seismicity nearby because you happen to do a lot of blasting nearby. You can also plot blasts as a function of distance to survey!
Training Resources
The distance to surveys feature allows you to filter based on distance to any surface. For example, you may be interested in events only within a certain distance to a fault.