Forward Analysis
Grid & Plane Setup window
The first step is setting up your Grid and plane you want to use for the analysis. Follow the link here on how the window works.
Current Sensors window
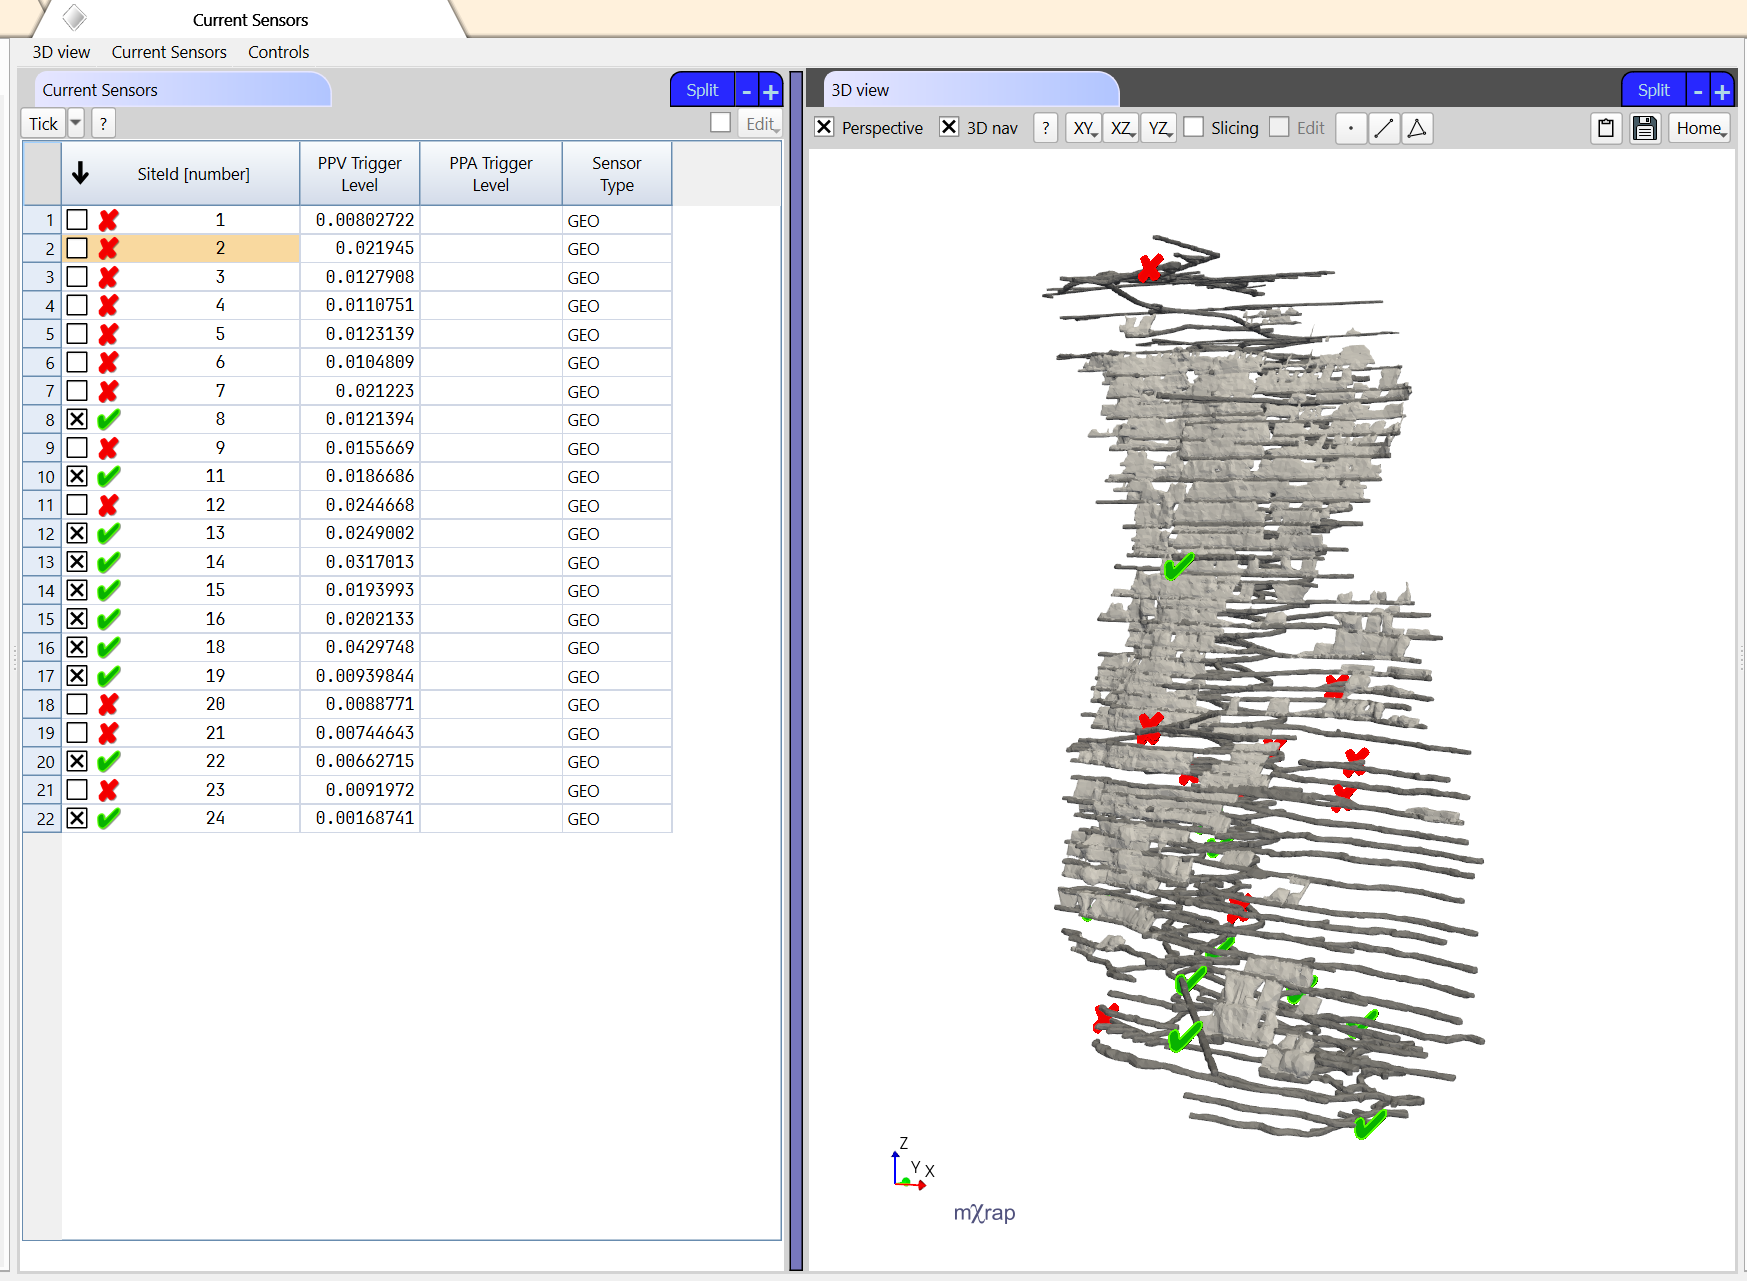
This window allows users to tick which sensors are currently active and should be used in the analysis. A 3D view is also shown to display the current sensors which are colored based on if they are active or not.
Add sensors window
This window allows new sensors to be added to the seismic system to see how the sensitivity improves in that area of the mine.
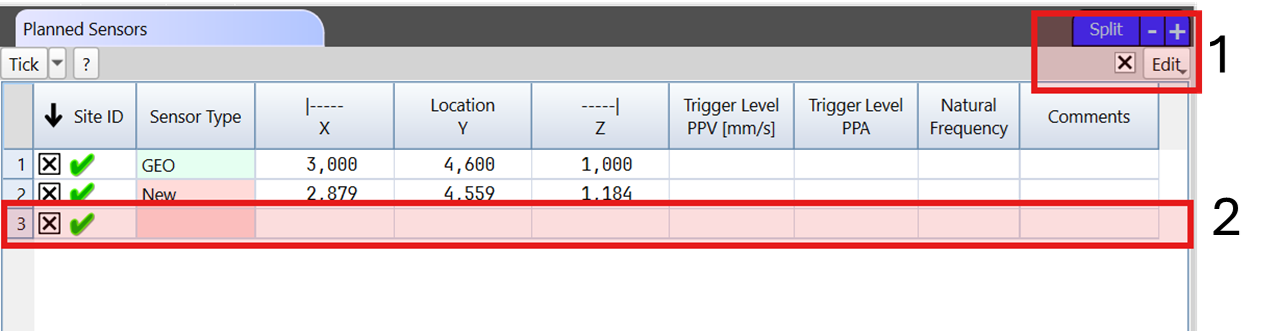
To add a new sensor, go to the Planned Sensors table and :
- Thick the Edit box and insert a new row.
- Input the required information in each column.
The system sensitivity can then be visualised in the 3D view. The surfaces or points can be colored by sensitivity, distance to furthest sensor required to detect an event, or the improvement to the sensitivity or distance.
Using the Sensors series in the 3D view, you can colour the sensors by Planned vs Current to highlight the new sensors.
Additional tools in the window
There are Analysis controls, Grid controls, Plane controls panels to help quickly modify information. The number of sensors needed to process an event is set in the Analysis controls panel.
There is a Grid Results table that can be exported to display the results in other softwares.
The Current Sensors table can be accessed in this window.
Exclude sensors window
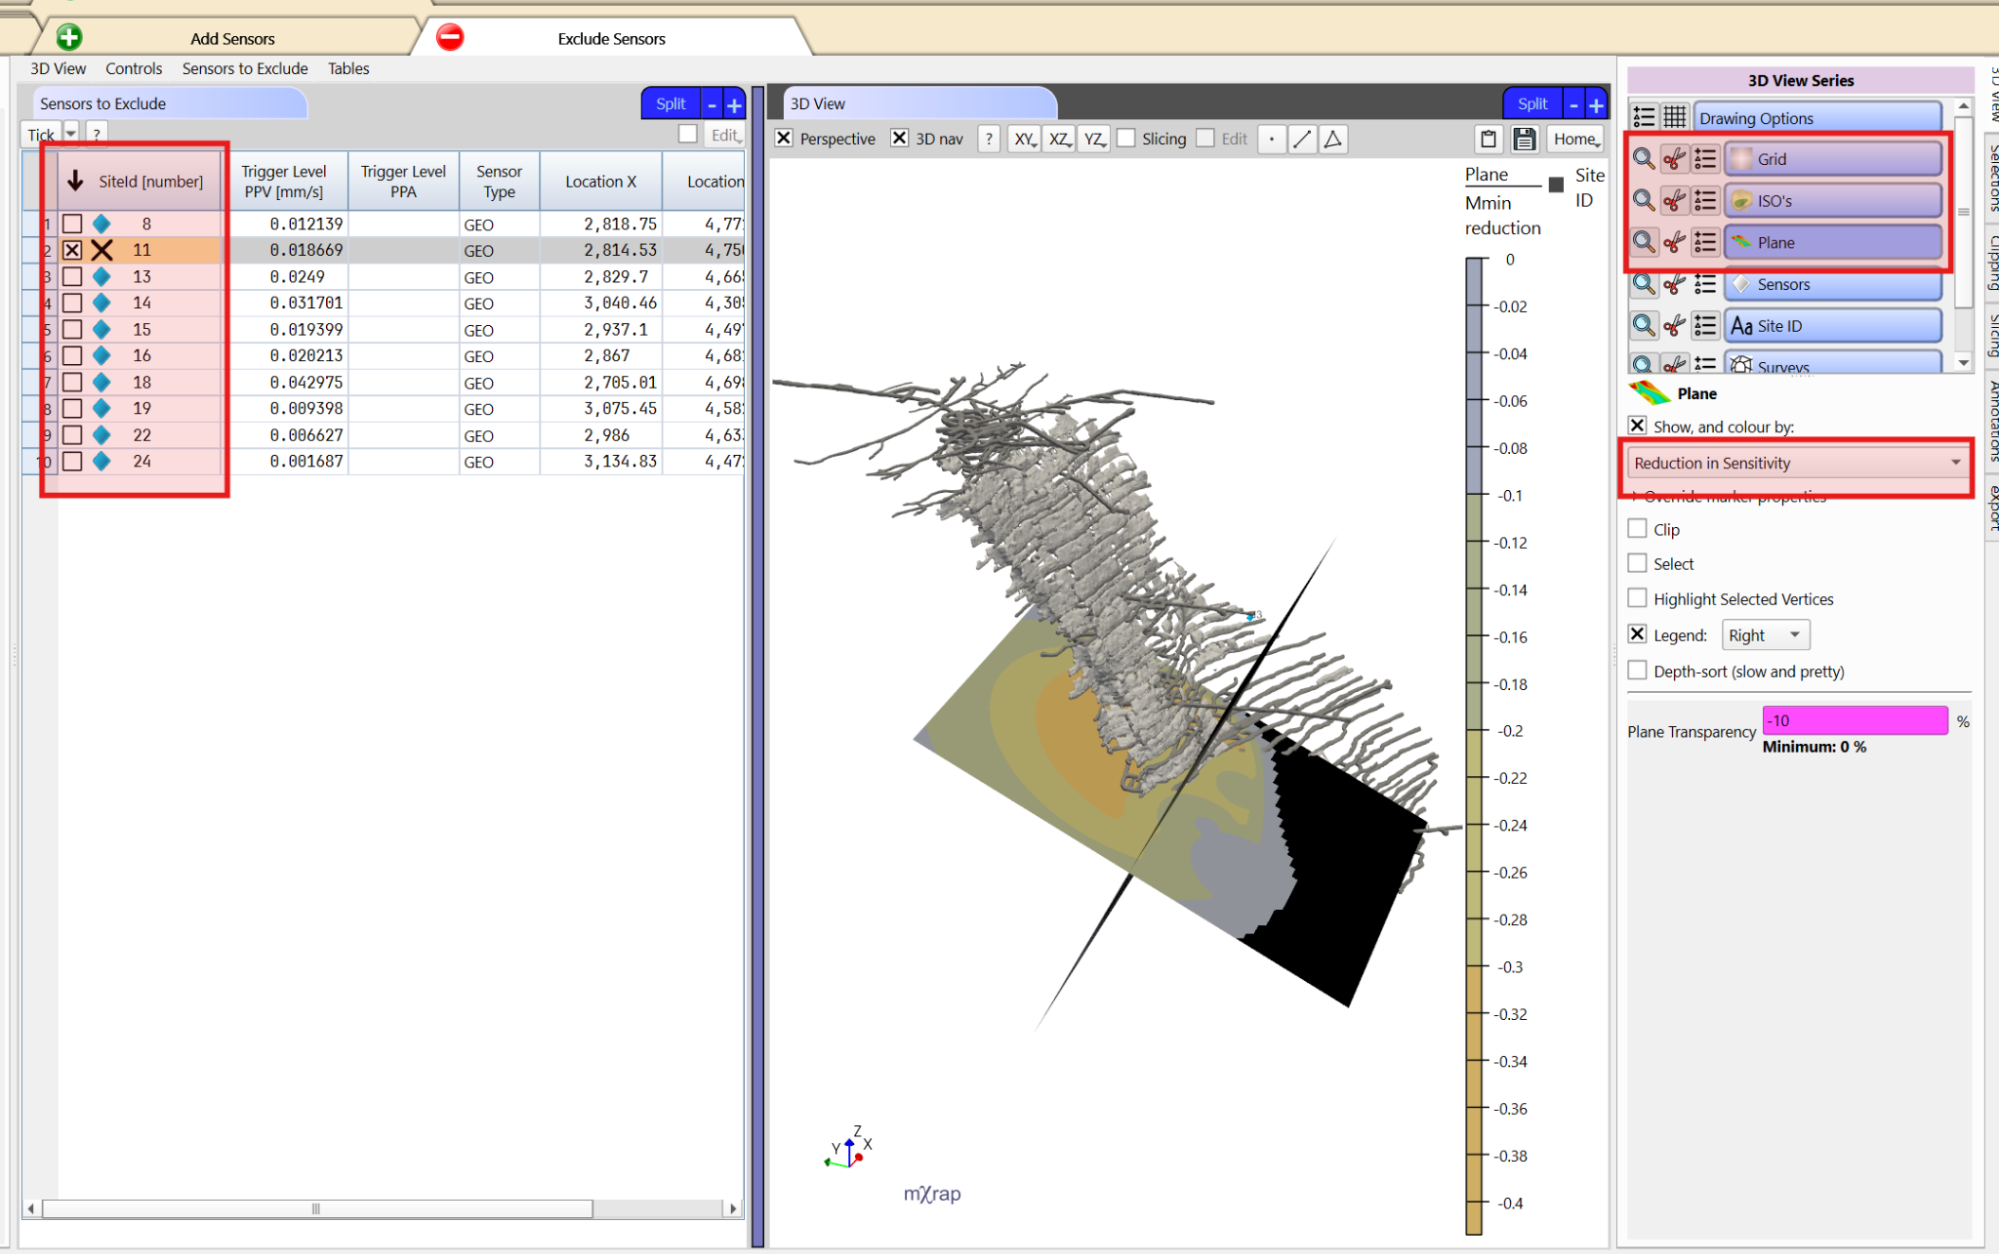
This window allows you to exclude sensors to evaluate the impact on the sensitivity in that area (if, for example, you lost a sensor or box). Simply tick a sensor in the Sensors to Exclude table to visualise the reduction in sensitivity and new sensitivity in the 3D view.
Additional tools in the window
There are Analysis controls, Grid controls, Plane controls panels to help quickly modify information.The number of sensors needed to process an event is set in the Analysis controls panel.
There is a Grid Results table that can be exported to display the results in other softwares.