Intact Rock
Refers to Lab tests (borehole and grab samples) and index tests.
Supported Data Types
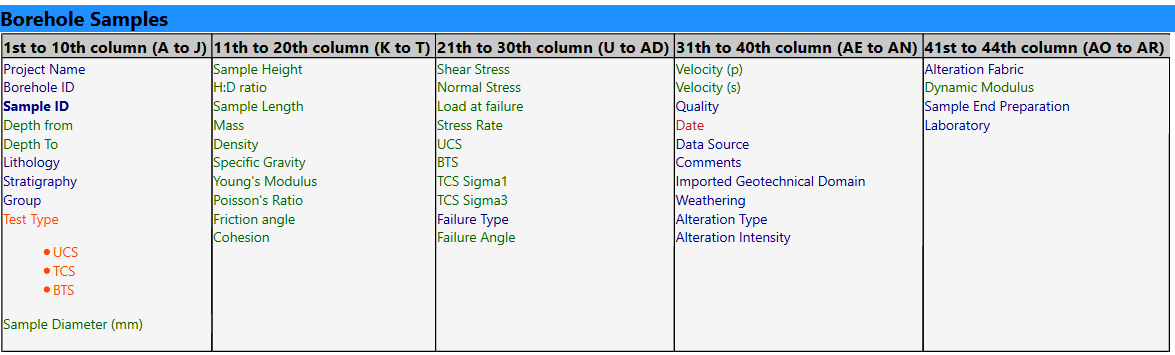
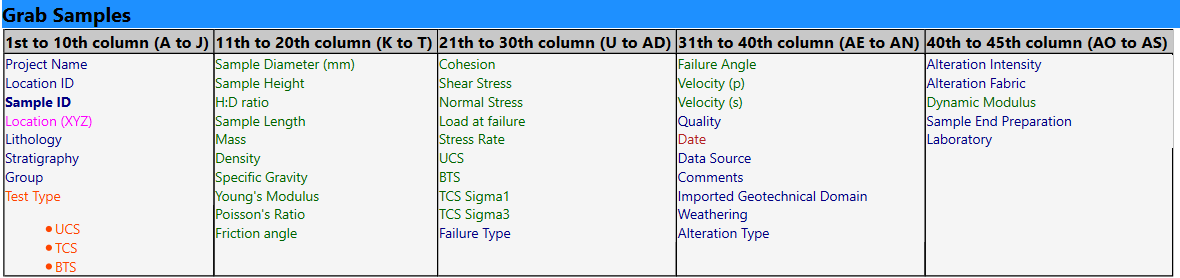
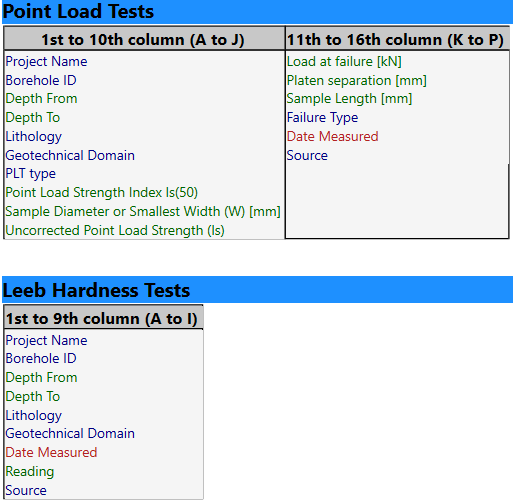
- Files imported must be in .csv format (auto-import with customized features OR manual csv import)
- Where there is no data available for the remaining columns leave blank.
- Columns in the .csv file must be in the order specified in the sections below.
- Columns in the specified format, according to this color code:
- Number column (green)
- Text column (blue)
- Specific Text column (category) - See Table below (orange)
- Date column : yyyy-MM-dd (red)
- Point columns : X Y Z (3 number columns) (pink)
Lab Tests
Index Tests
Key Features
- Auto-import of database or Manual csv import (boreholes samples & Grab samples)
- Import lab test data:
- Import index test
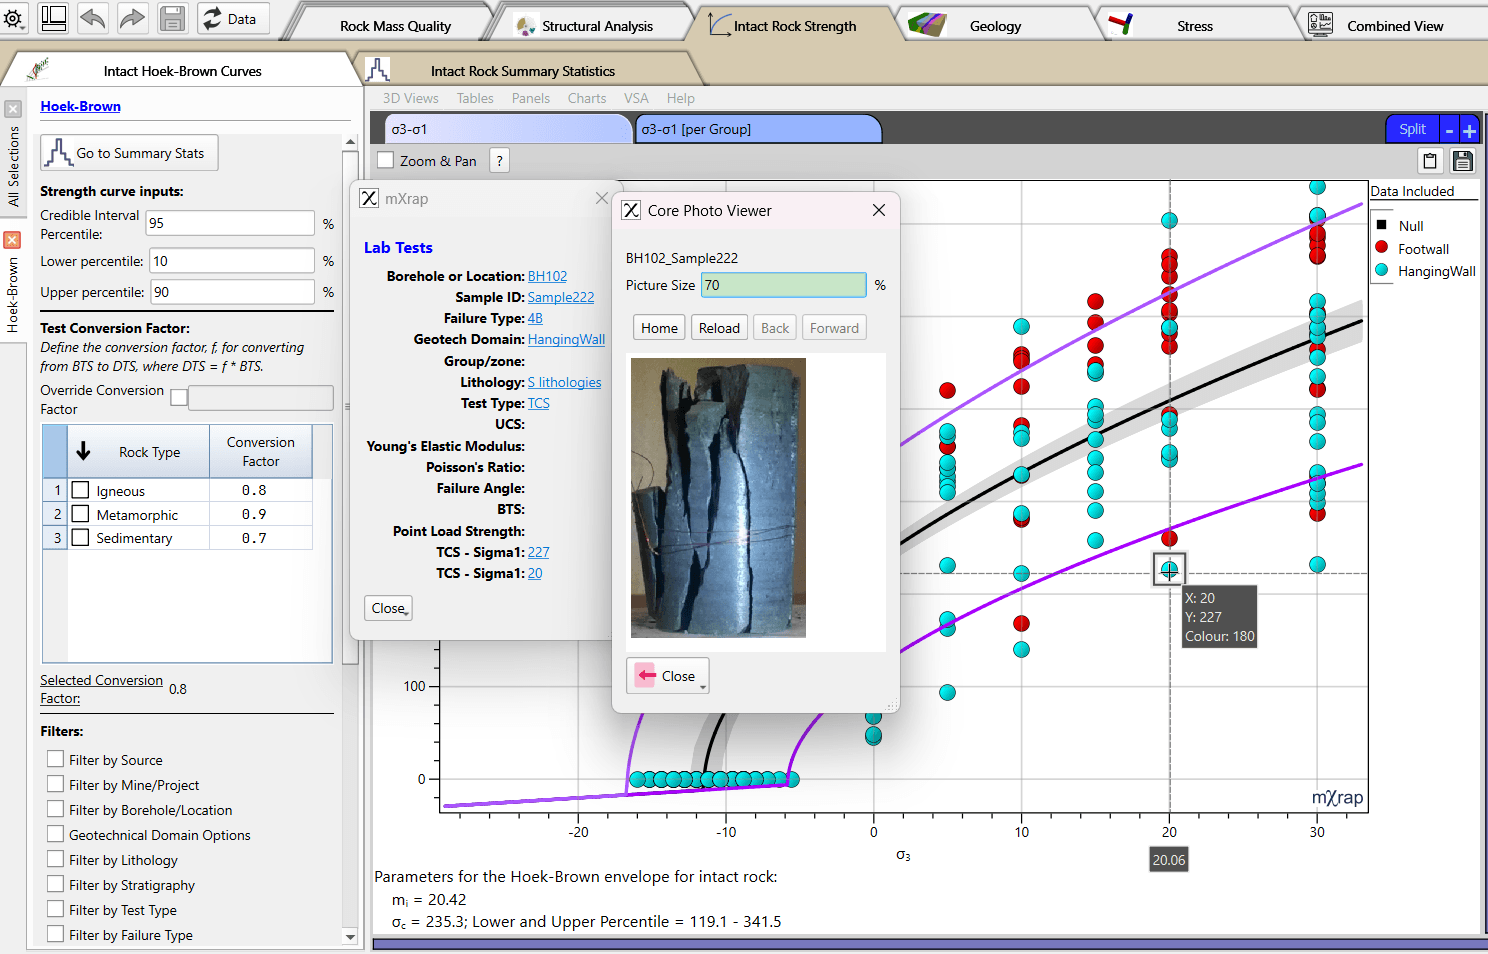
- Generate Hoek-Brown failure envelopes
- For all data
- Per data groups (lithologies, geotechnical domains, or both)
- Generate equivalent Mohr-Coulomb criterion
- Produce a summary report (html)
- Core photo viewer of sample directly on charts (by double-clicking on point)
- Establish equation between index tests and UCS lab tests results
Theory
Hoek-Brown fit variation
Every time there is a change in the data, the analysis is re-run. We are actually in a 'sprint' to document all the stuff that we have not yet (we have a certain back log...) and that includes the Hoek-Brown calculations. It will be then soon available on the website. In the meantime, here is more info :
- Please find attached the paper on which the calculations are based on.
- The conservative and optimistic are generated by taking the best fit of the mi
- The upper and lower UCS is then defined by taking the equivalent UCS of lab test for 500 different sample fits (so those random sampling fits makes the values a bit different every time) splattering it on S3 = 0 and then taking the upper and lower percentile
You can see all the of the UCS and mi best-fit of the sampling fits in opening the chart 'sigma c vs mi Scatter plot' in the Rock Mass Data analyser - see screenshot. The best green circle probably changes a bit from time to time. I would be concerned if the values changes a lot.
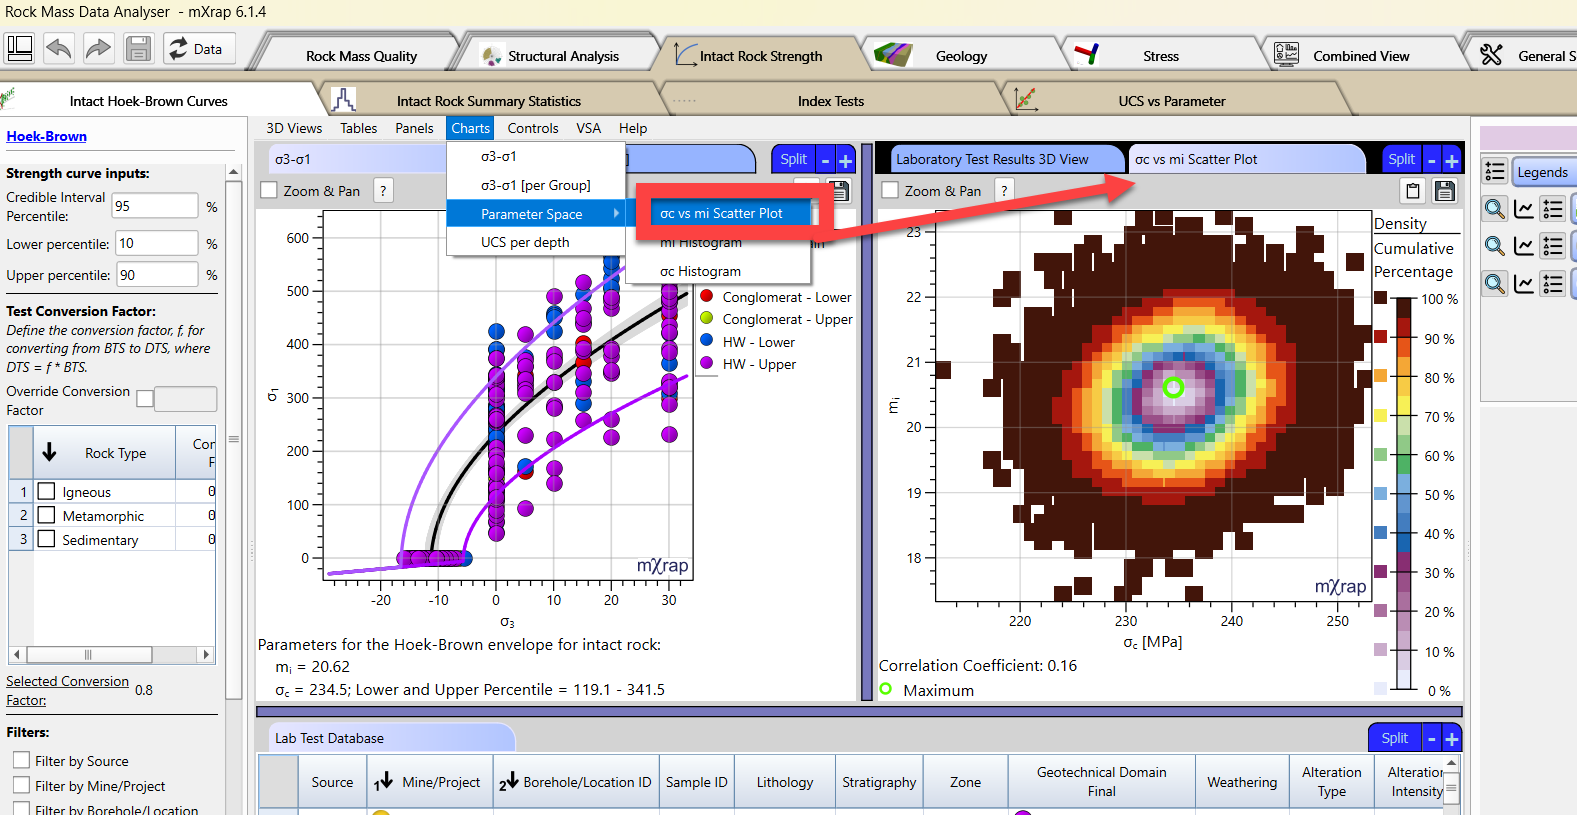
As for the curve fitting algorithm / error model, we use an error scaling.
- We apply an automatic scaling to the BTS error term based on the relative number of BTS measurements compared to UCS and UTS. When there are relatively few BTS points, their errors are scaled by mᵢ so that the lower part of the curve is not overwhelmed by the UCS and UTS data. This tends to prioritise a more reasonable mᵢ at the expense of SigCi. In theory we could fit multiple models and select the best one using fit independent criteria, but that would be more computationally expensive.
FAQ
Can I import the PLT results as a UCS?
It is not recommended. We recommend to import your raw PLT data and therefore establish a relation with the UCS measured in laboratory.