Marker Styles
Marker styles specify how values are mapped into colours. They are used when plotting data in 3D as points, lines, or surfaces; when plotting on charts as points or lines; and sometimes in tables to set the background colour for cells or to display a coloured symbol in the cell. Marker styles also define the symbol that is used when data is plotted as points in 3D or on charts, or when displaying a coloured symbol in a table cell.
Often a particular data series will have multiple marker options available. For point data you will see a markers as option in the series control panel, with a dropdown menu containing all of the available marker options. For example a series displaying seismic events may have marker options for colouring the data by local magnitude, event date, seismic moment, and various other source parameters. For surfaces or lines in a 3D view you will see a show, and colour by option in the series control panel, this similarly has a dropdown menu containing all of the available marker options.
Overriding marker properties
mXrap makes it easy to quickly adjust series marker styles on the fly, using the override marker properties section in the series control panel.
- Adjust lightness and transparency
- Change the colour and image for single-colour point markers
- Modify the colour of survey series
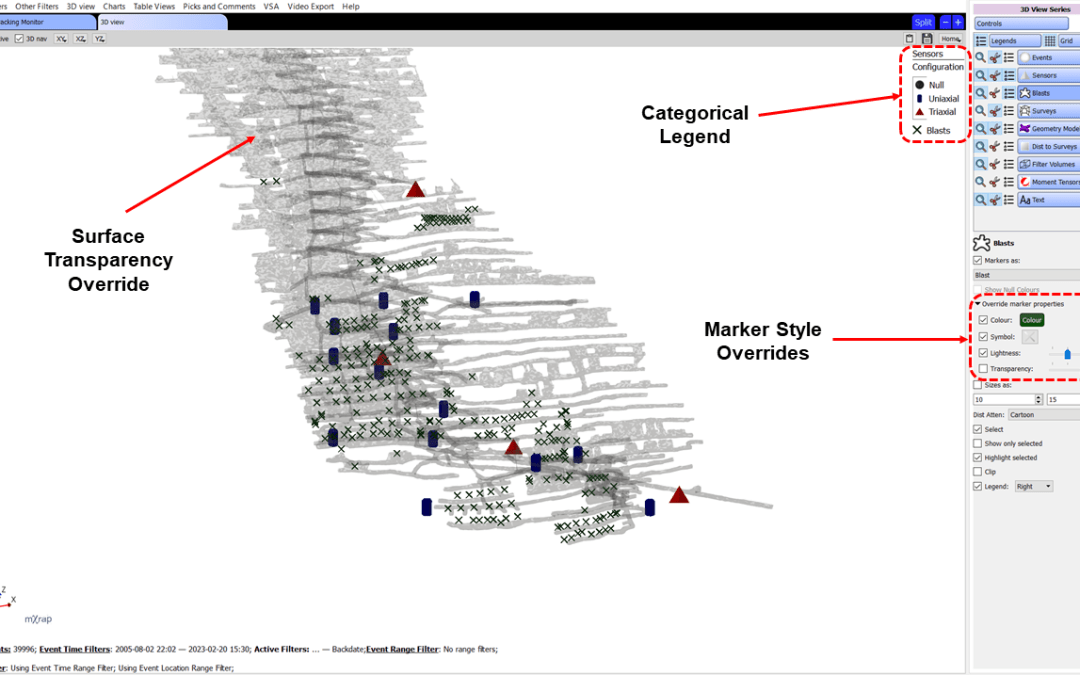
The marker style override system allows you to make temporary adjustments to how data is displayed without permanently modifying the underlying marker style definition. These overrides are saved into your workspaces.