Simple Response Viewer
This window is for the assessment of short-term responses. Triggers are selected from the list and response events for the selected triggers can be assessed with several tools:
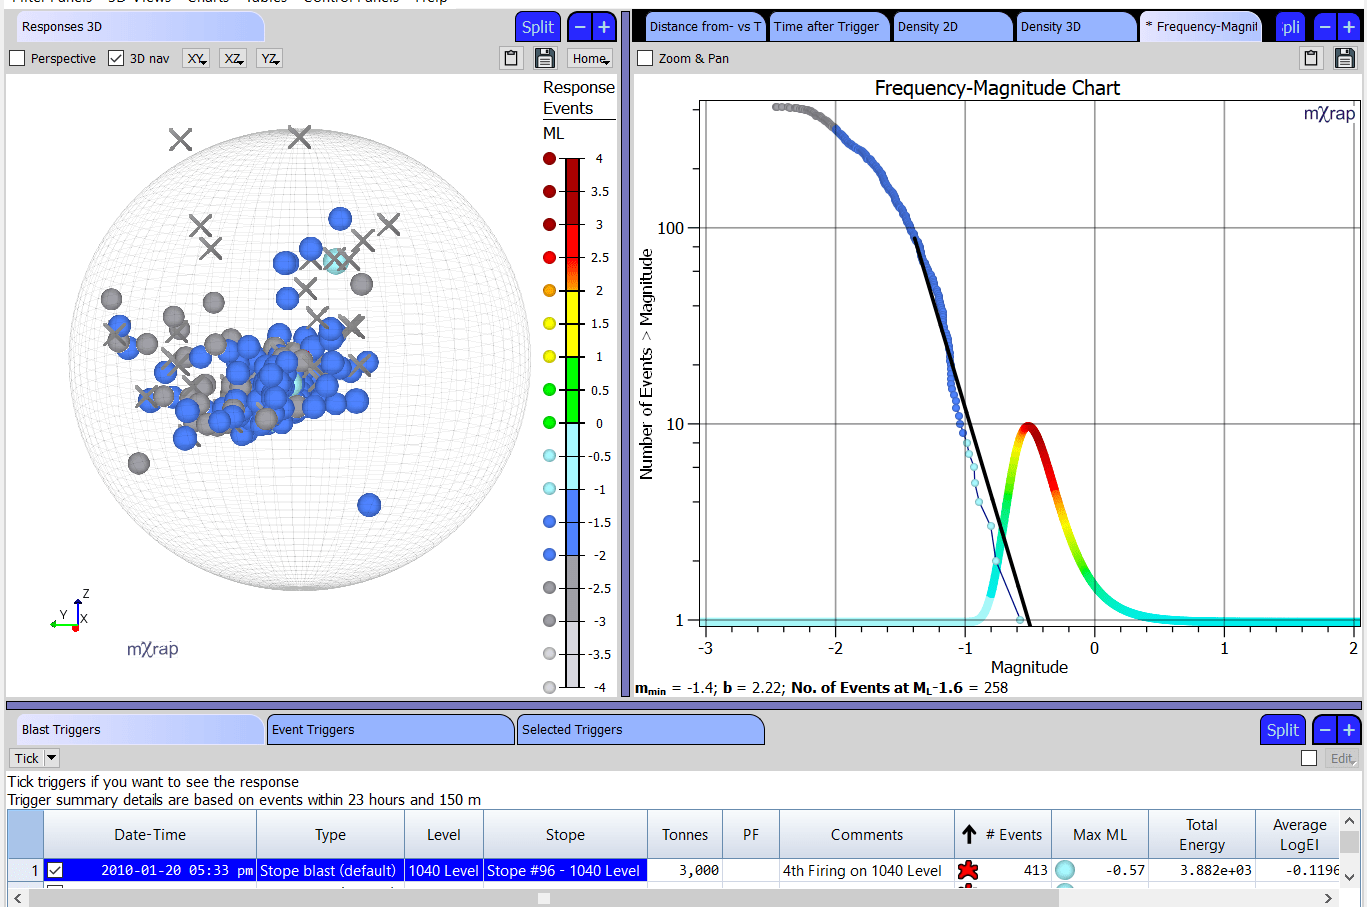
- Responses 3D View- View the trigger locations and response events within range. Adjust the spheroid controls to include/exclude events associated with the trigger. 'Nearby events' are events just outside the spatial or temporal range of the trigger.
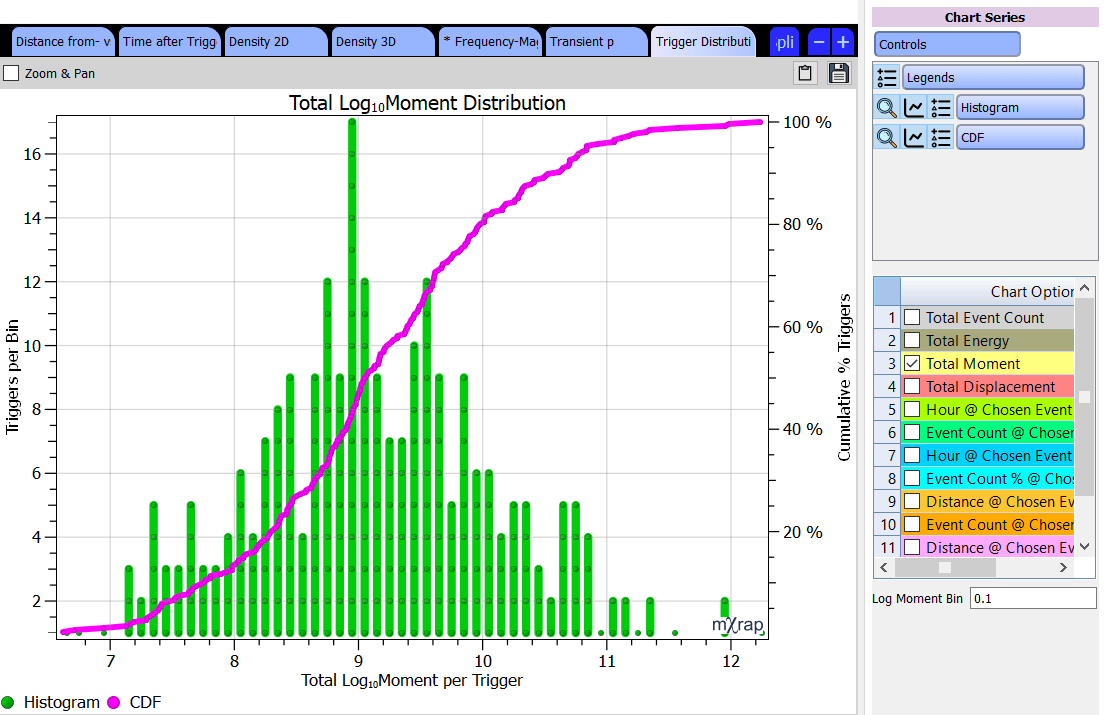
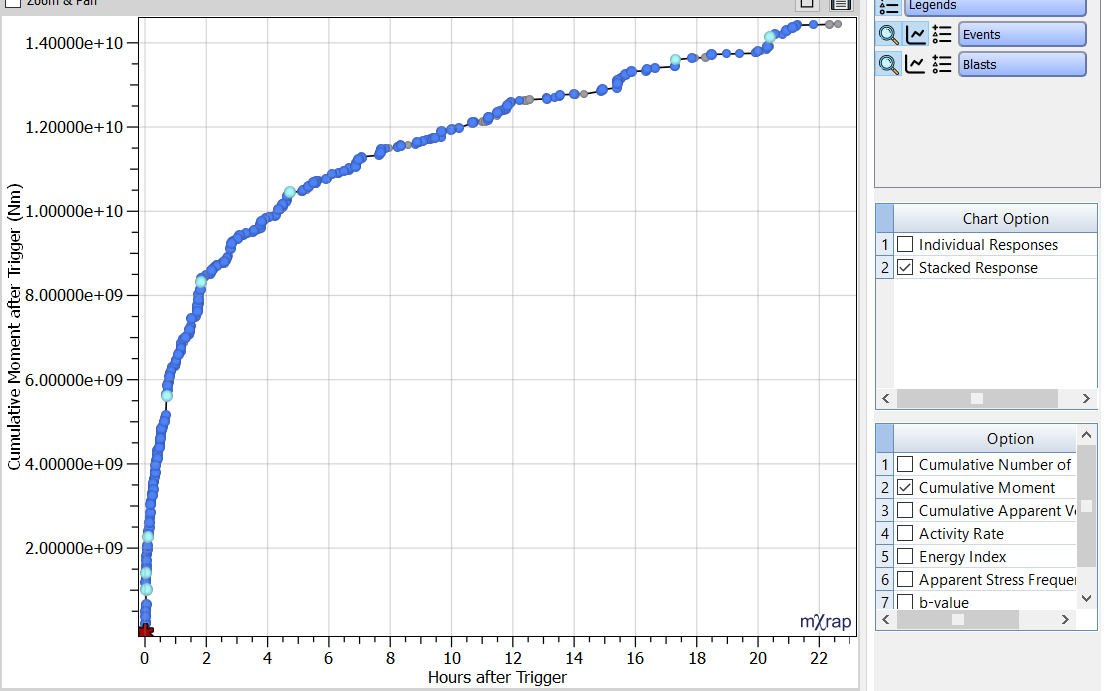
- Time after Trigger Chart – Individual and stacked responses are plotted as a function of time after trigger as a histogram or cumulatively. The best fit Modified Omori Law (MOL) is calculated automatically. If the calculation fails a message will appear in the control panel and MOL parameters (p, K and c) can be modified in the control panel.
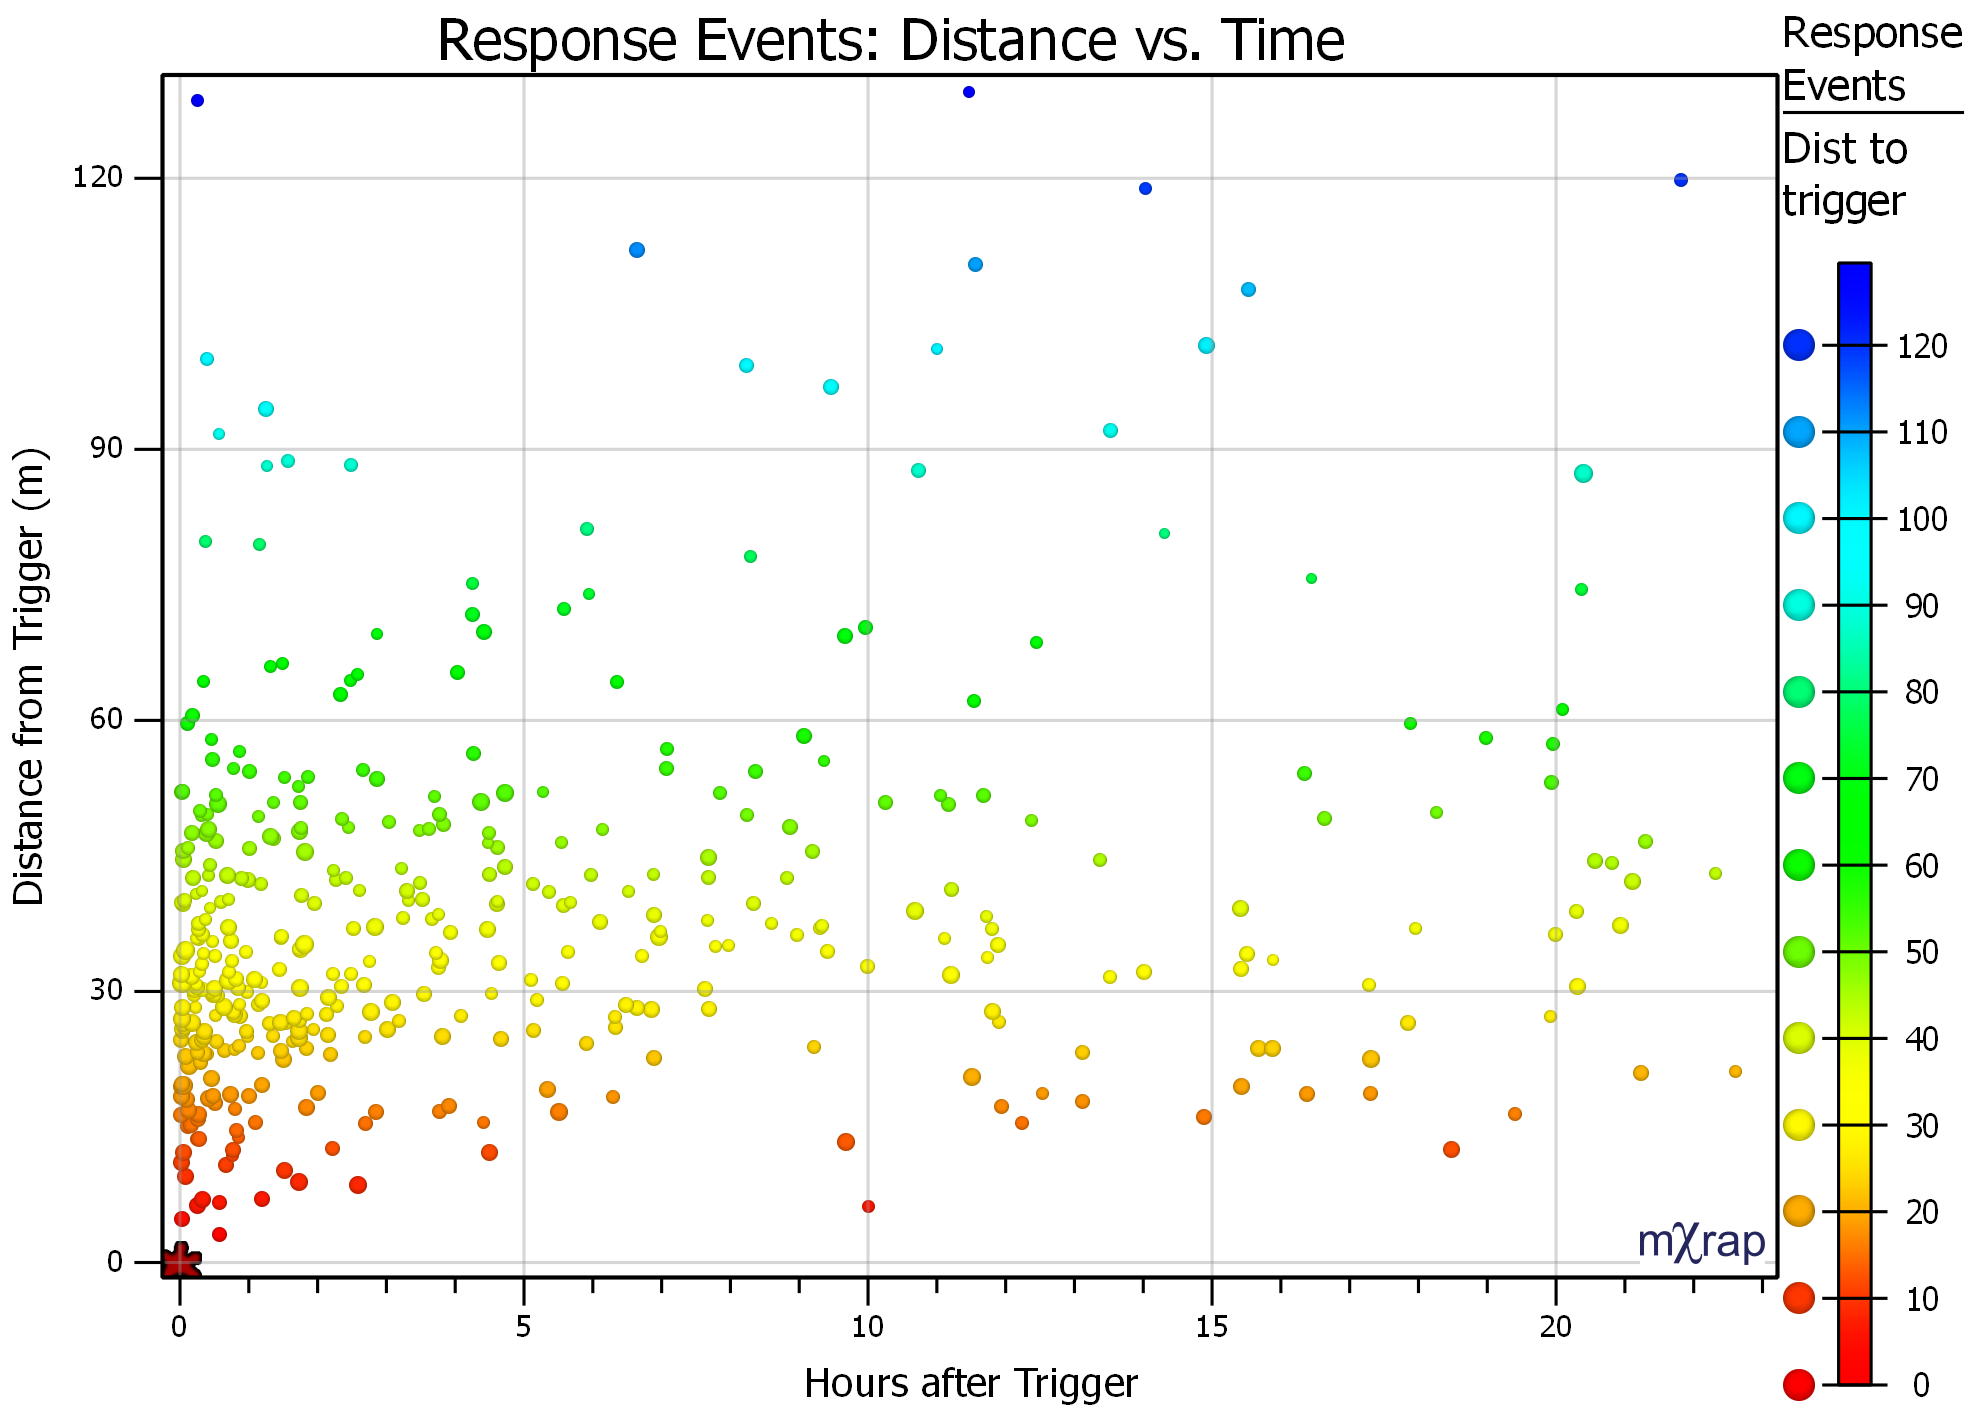
- Distance from Trigger Chart - Plots events as a function of distance to trigger. Options include the X distance, Y distance, Z distance, horizontal distance and 3D distance. The distances can also be normalised by the number of events or by the volume under consideration. Normalisation by number of events changes the chart’s Y axis to a percentage of events from 0–100% while normalisation by volume changes the X axis so that the volume increases linearly as the spherical distance increases (a constant event density would be a linear plot of cumulative events).
- Density Chart – Displays the distribution of events in the 2D plane (XY, XZ or YZ). Events are divided into spatial bins and then ranked from highest to lowest density. The grid points are coloured by cumulative event density.
- Density 3D View – Iso surfaces are used to illustrate the 3D cumulative events density.
The time window and distance from trigger may be different to the response analysis. For example, the seismicity within 3–6 hours after the trigger gives a reasonable estimate of the size of the response to the trigger, but for response analysis you usually want to see a longer period in the charts.
There have been a number of recent updates to the Short-term Response Analysis app. These include:
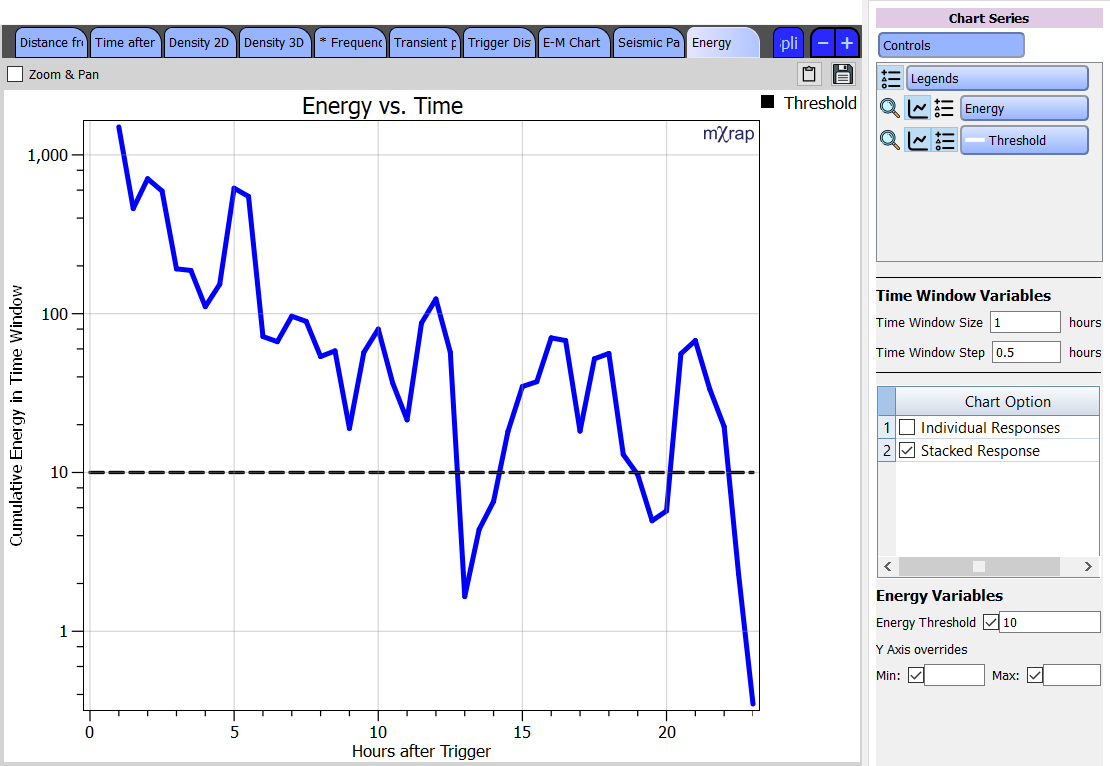
Chart for determining re-entry using different parameters: This chart gives you values for a particular parameter over time (based on a user-defined time window size and step). A threshold value for that parameter can be set, allowing you to see when the seismic data drops below that threshold. The parameter investigated can currently be set to energy, event count, hazard, background ratio and activity rate probability. For more information about these parameters, see Tierney et al. 2019.