Per-Stope Analysis
Purpose
Assessment of performance on a per stope basis. The most basic form of analysis used to identify broad trends, for example, comparing overbreak of stopes from different regions in the mine.
Analysis options consist of:
- 3D view
- Tables (regular and LITE version)
- Charts:
- A vs B Chart
- Cumulative Chart (Two Series)
- Cumulative Chart (Group By)
- Cumulative Log Chart (Group By)
- 3D Chart
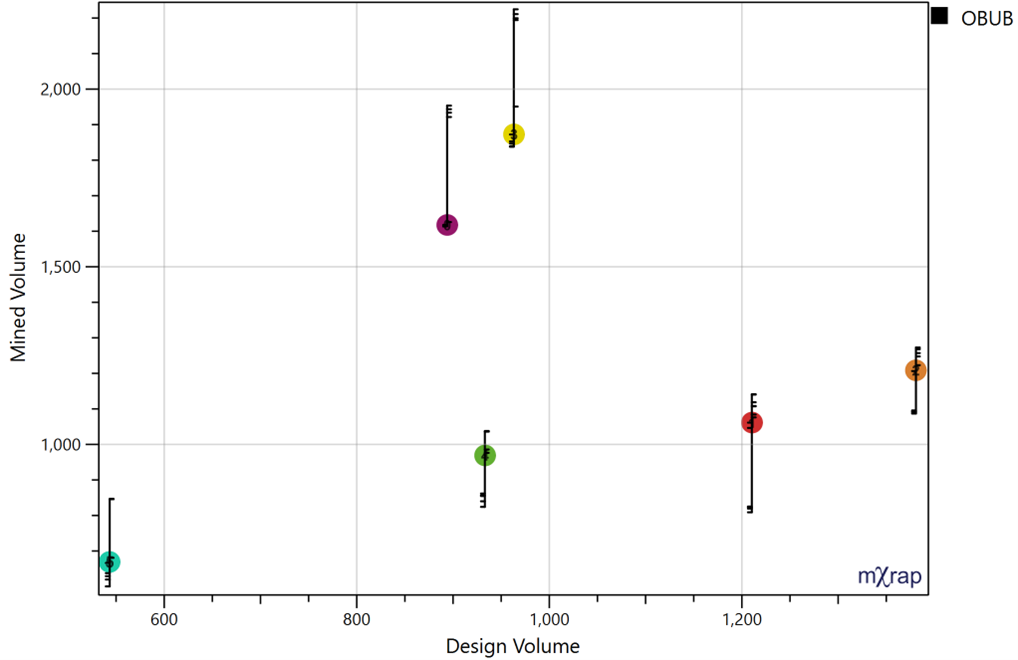
- Design vs Mined
- This chart allows to visualise design vs mined volume with OB and UB volumes plotted as lines above (OB) and below (UB) the stope point.
At a per stope resolution, broad parameters can be queried and are listed here:
- Design, Mined or Fill volume
- First or Last blast date
- Stand-up time (days)
- Different tags (access, Method, region, sequence)
- Position (X,Y,Z)
- Stope performance
- OB (volume, %, rock, fill)
- UB (volume, %, rock, fill)
- OB + UB (%)
- Recovered (%)
- Compliance to design (%)
- Volume difference (%)
nota
Right side panels are opened by clicking on the table/chart/3D view, then clicking Controls in the right-hand Chart Series panel
Video
Explains the Per Stope window layout and tools in the stope reconciliation Analysis App.