Monitoring the hazard status
Drawpoint moisture
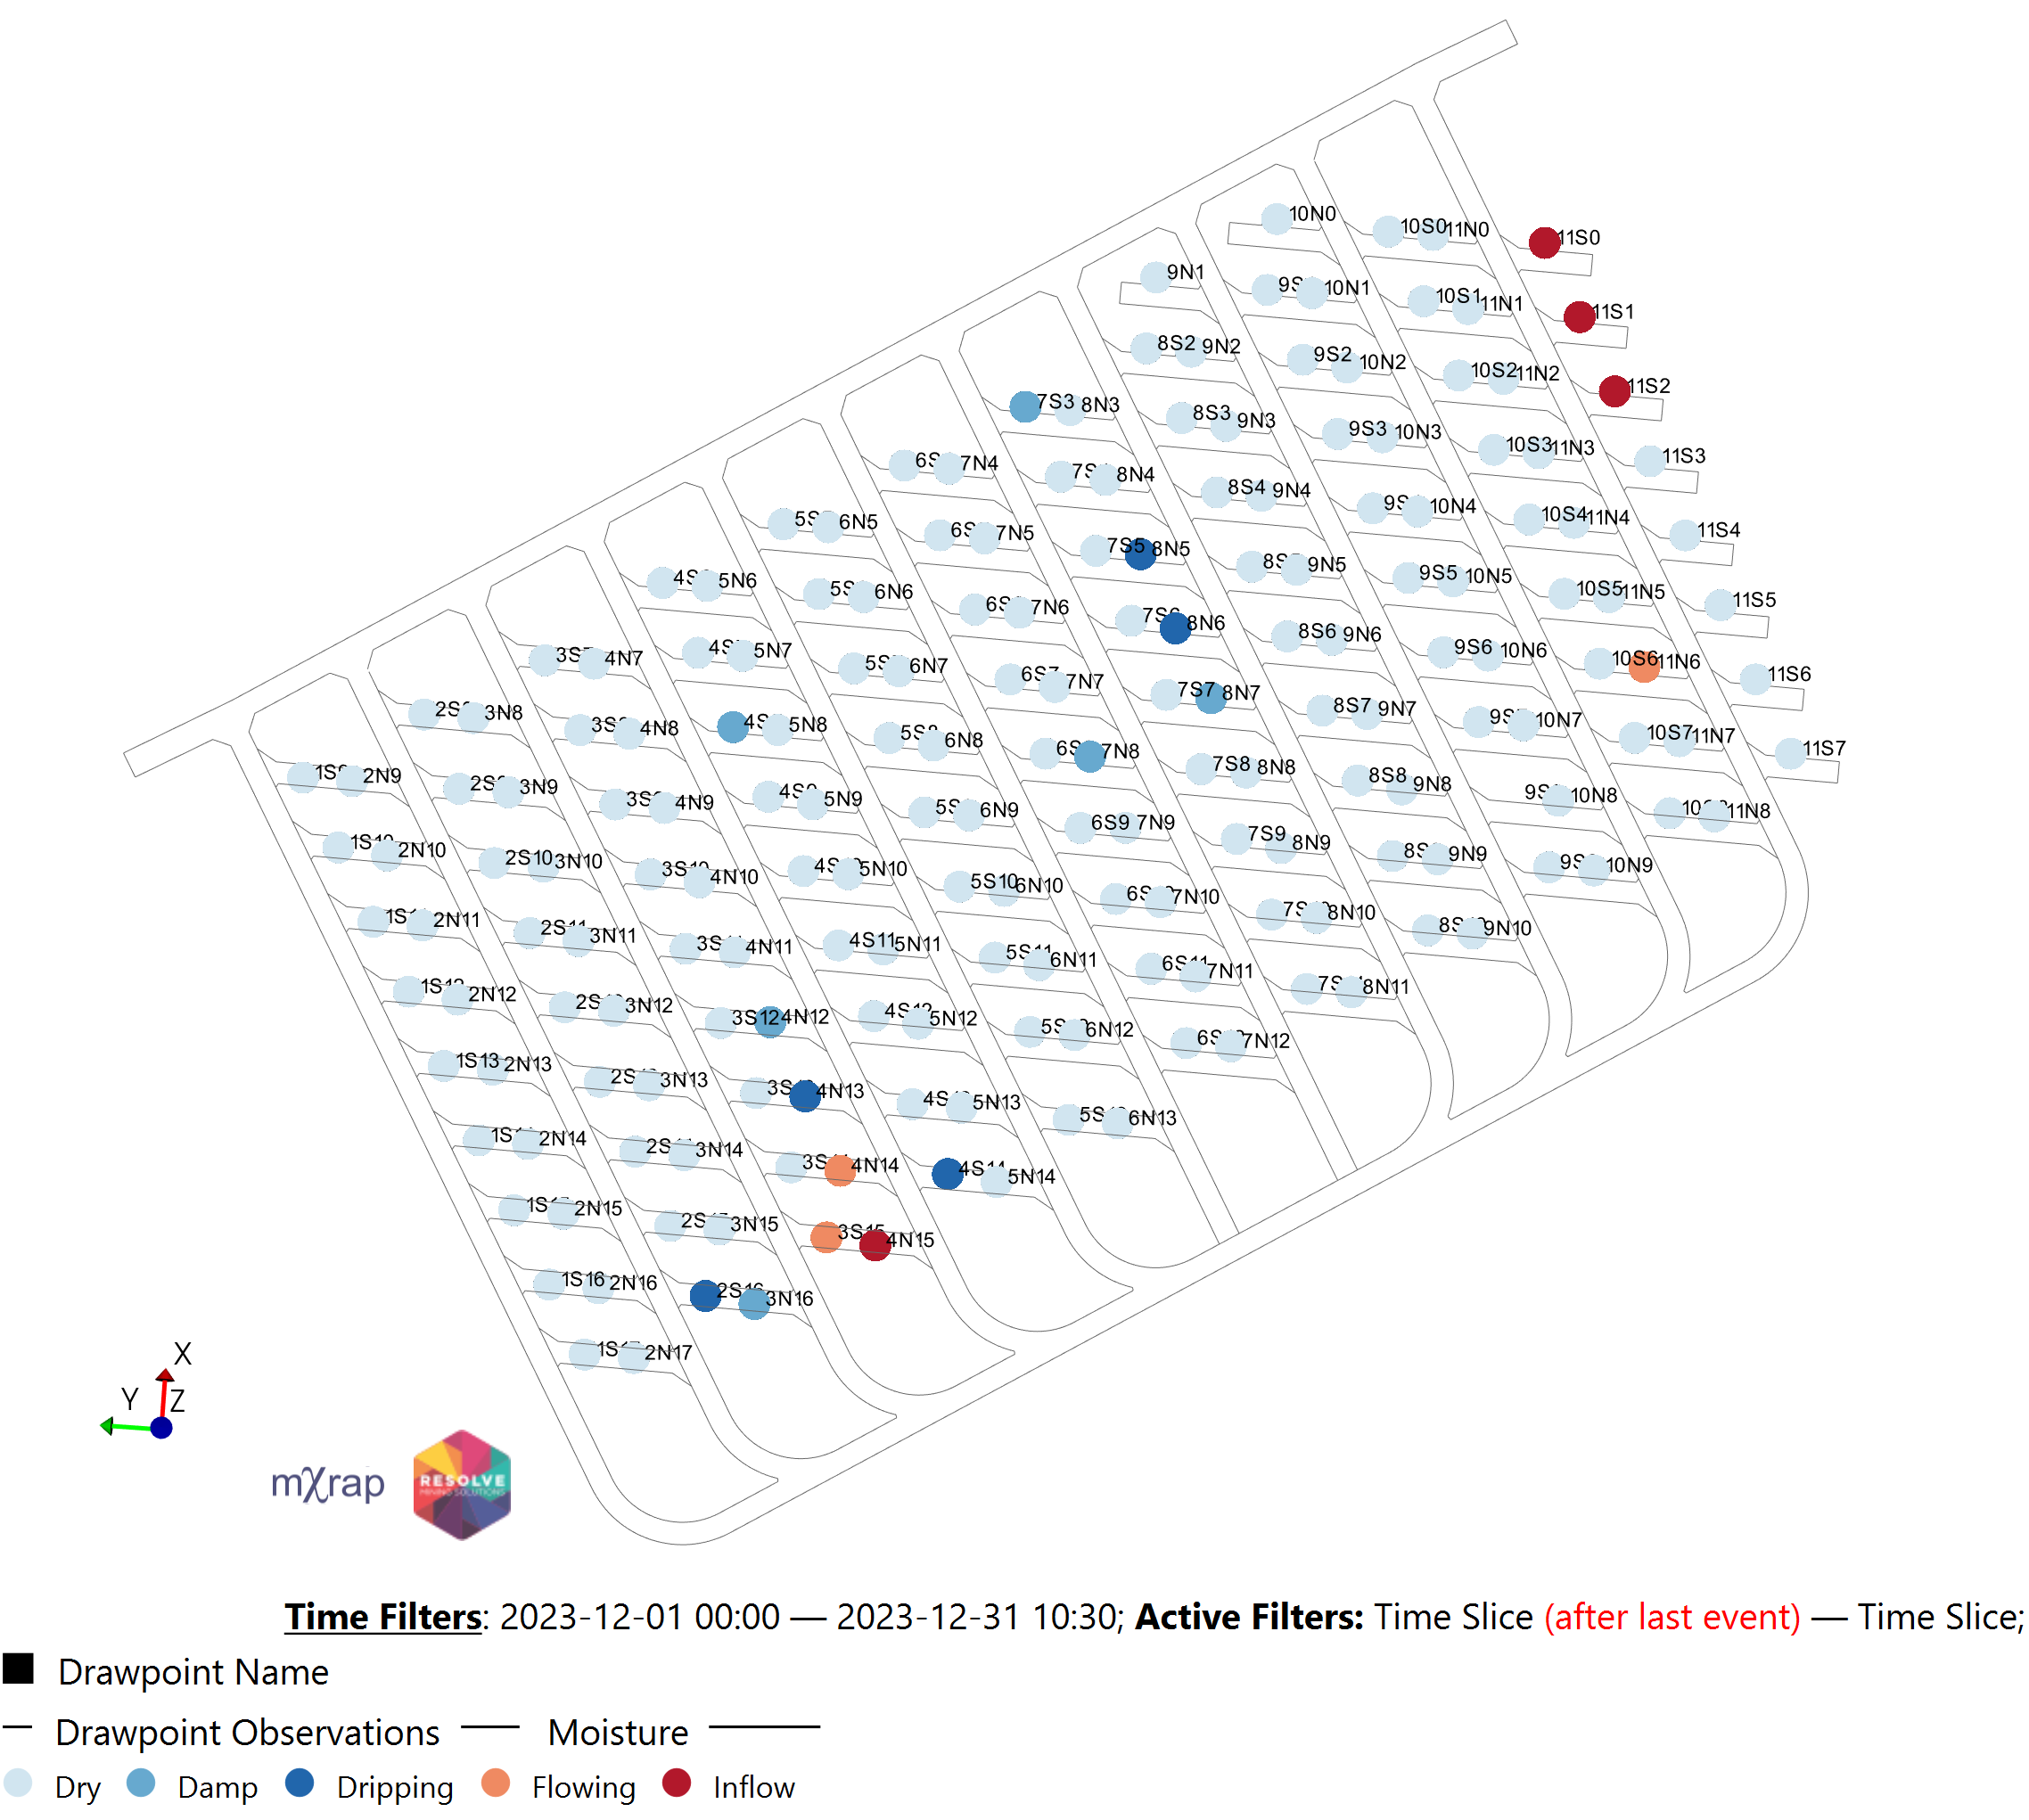
Figure 2 shows the plan overview of the observations made at the drawpoints across the extraction level concerning moisture. Using typical user defined categories, and an accessible colour scheme, the user can quickly and easily see where there is higher water inflow into drawpoints on the level. This data is also used in calculating the inherent risk of an inrush as described later in this section.
Flow control damage
Whilst damage to the material flow control devices being used across a block cave footprint do not directly impact the likelihood of an inrush event occurring, loss of flow beams, steel sets or other similar devices can artificially increase the height of the drawpoint and therefore increase the volume of material that can flow out of the drawpoint before it becomes choked. This has the potential to be an important consideration for hazard control across the level and erodes the effectiveness of controls against inrush.
Figure 3 shows the level plan and visualisation of flow control damage. This data can also be useful in providing service crews with maintenance tasks, scheduling for replacements and discussions with management around budgeting and performance across the level.
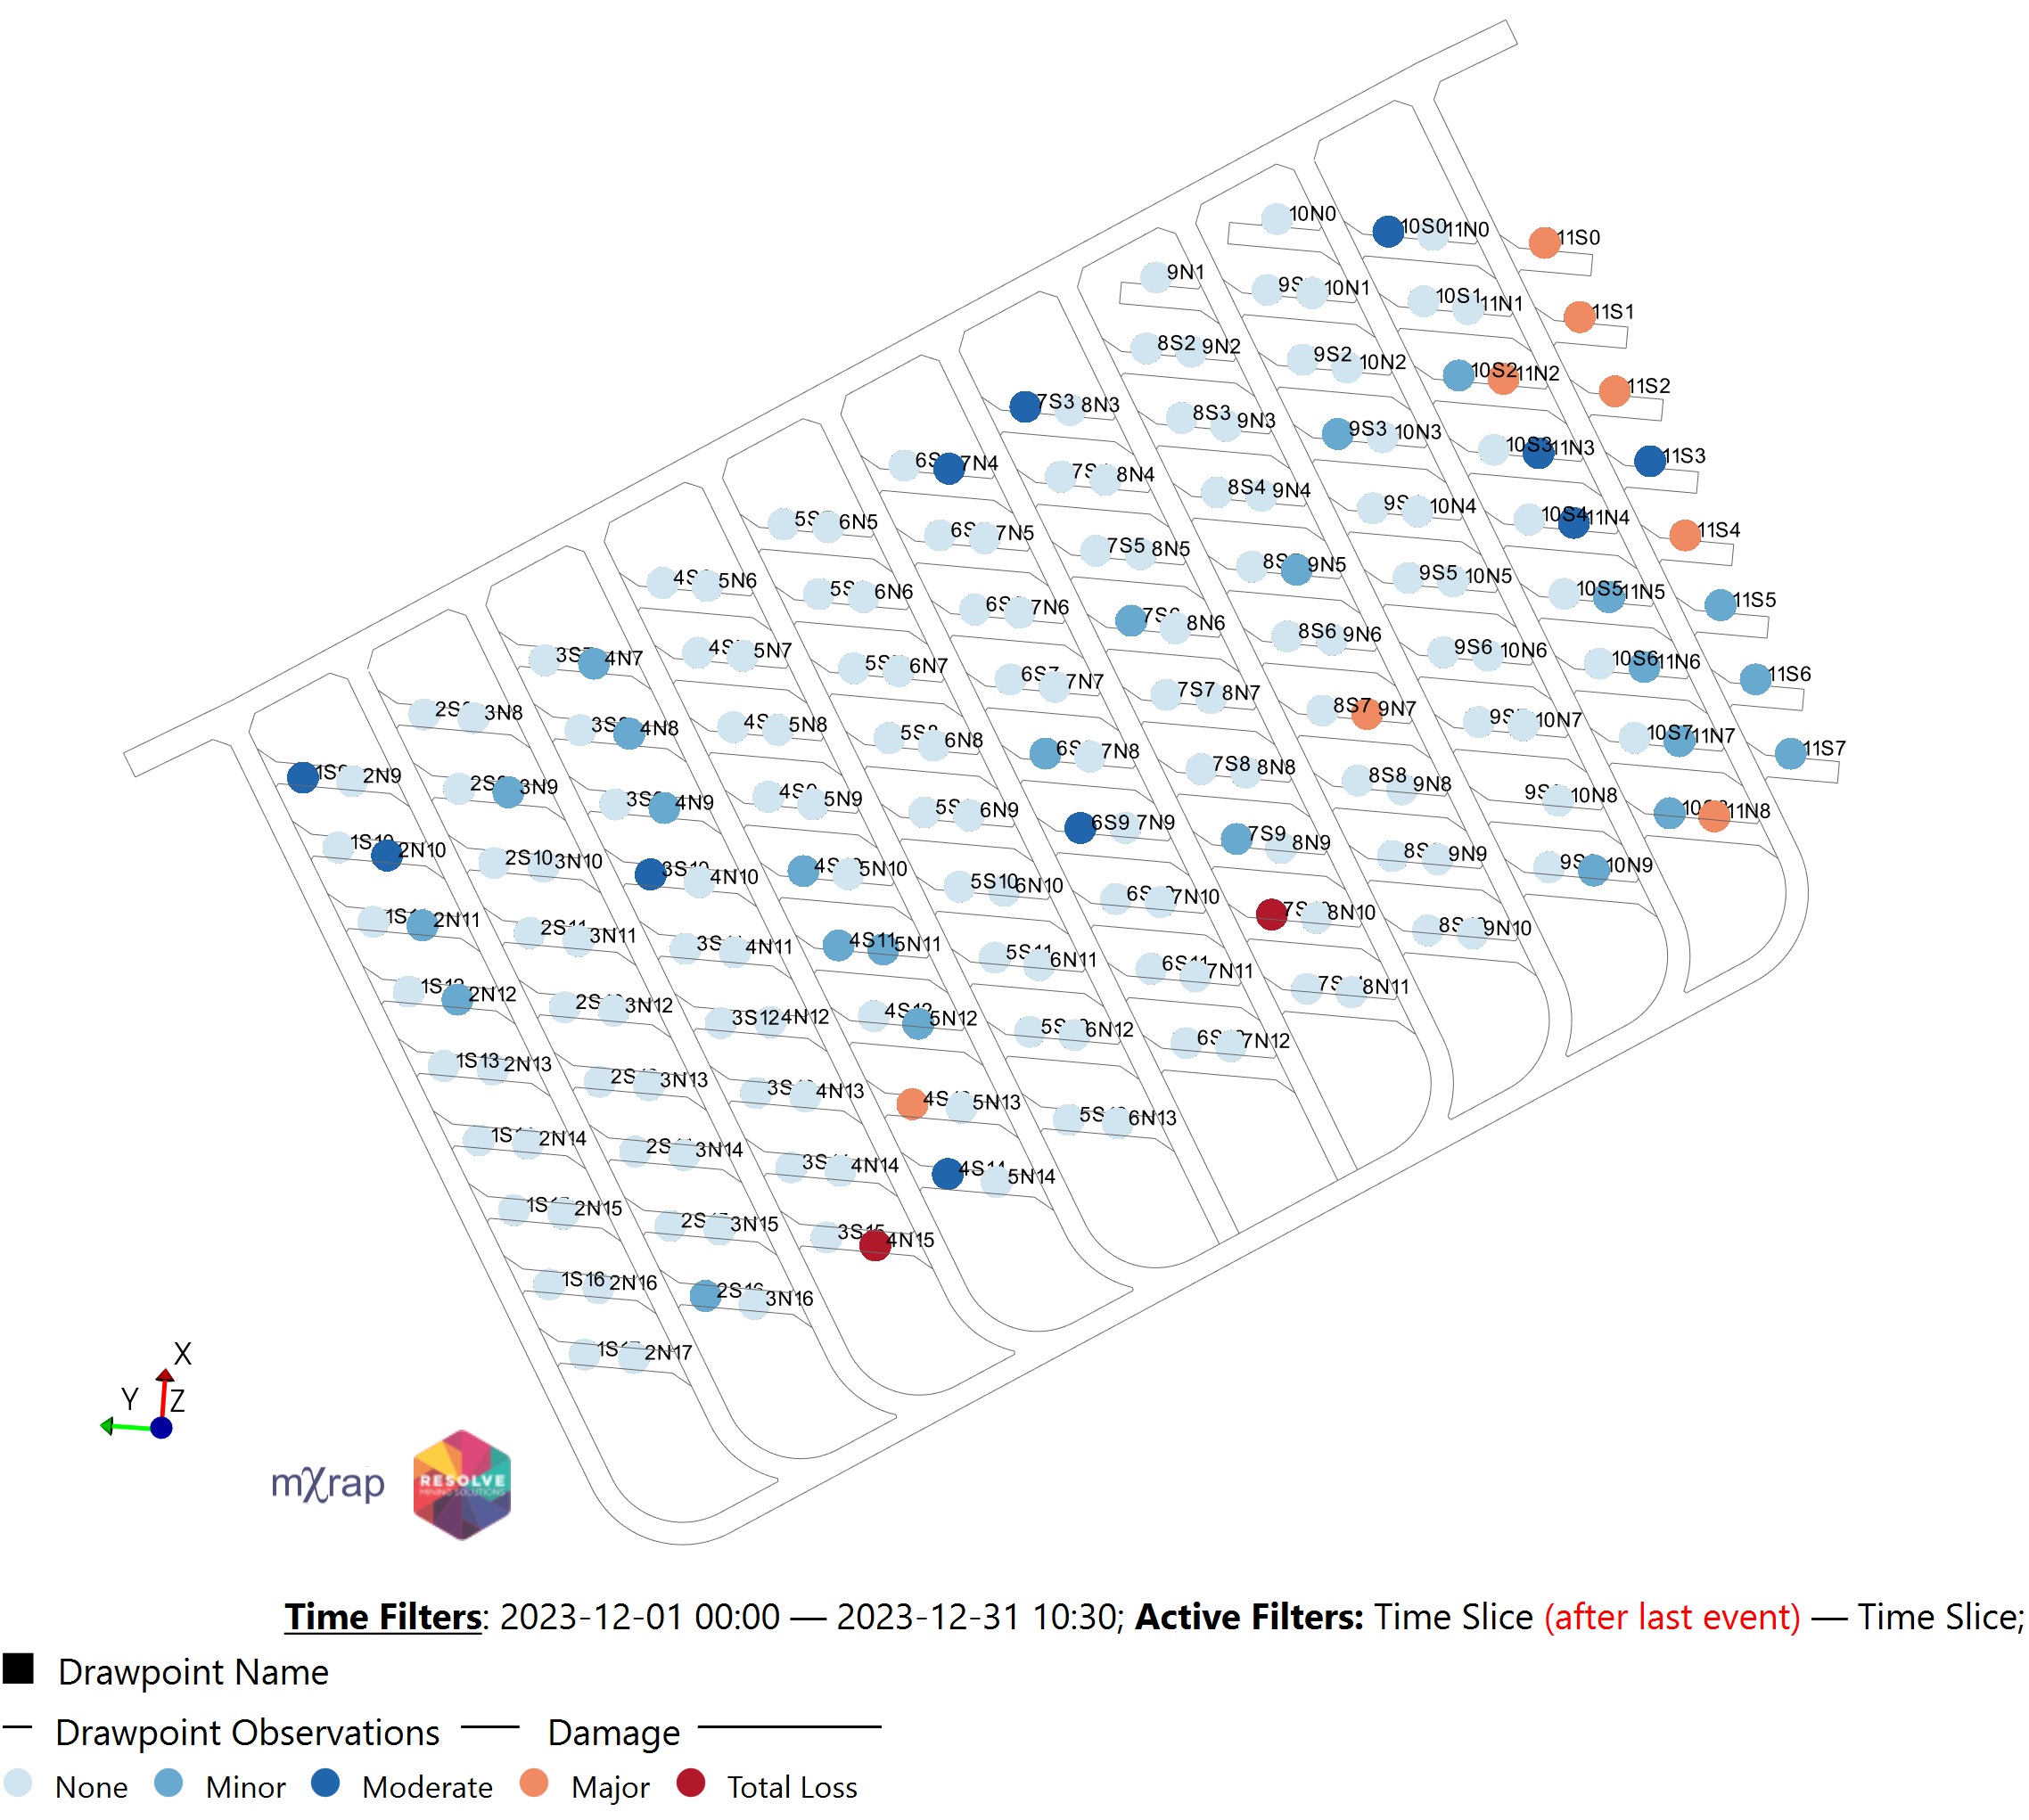
There is also the ability to incorporate the drawpoint height into the app and map this in a similar way to what's shown in Figure 3. This can be beneficial for understanding the exposure to potentially larger inrush events, regardless whether drawpoints are different dimensions by design or overbreak. Drawpoint height and overbreak is also included in the bund calculator.
Drawpoint status
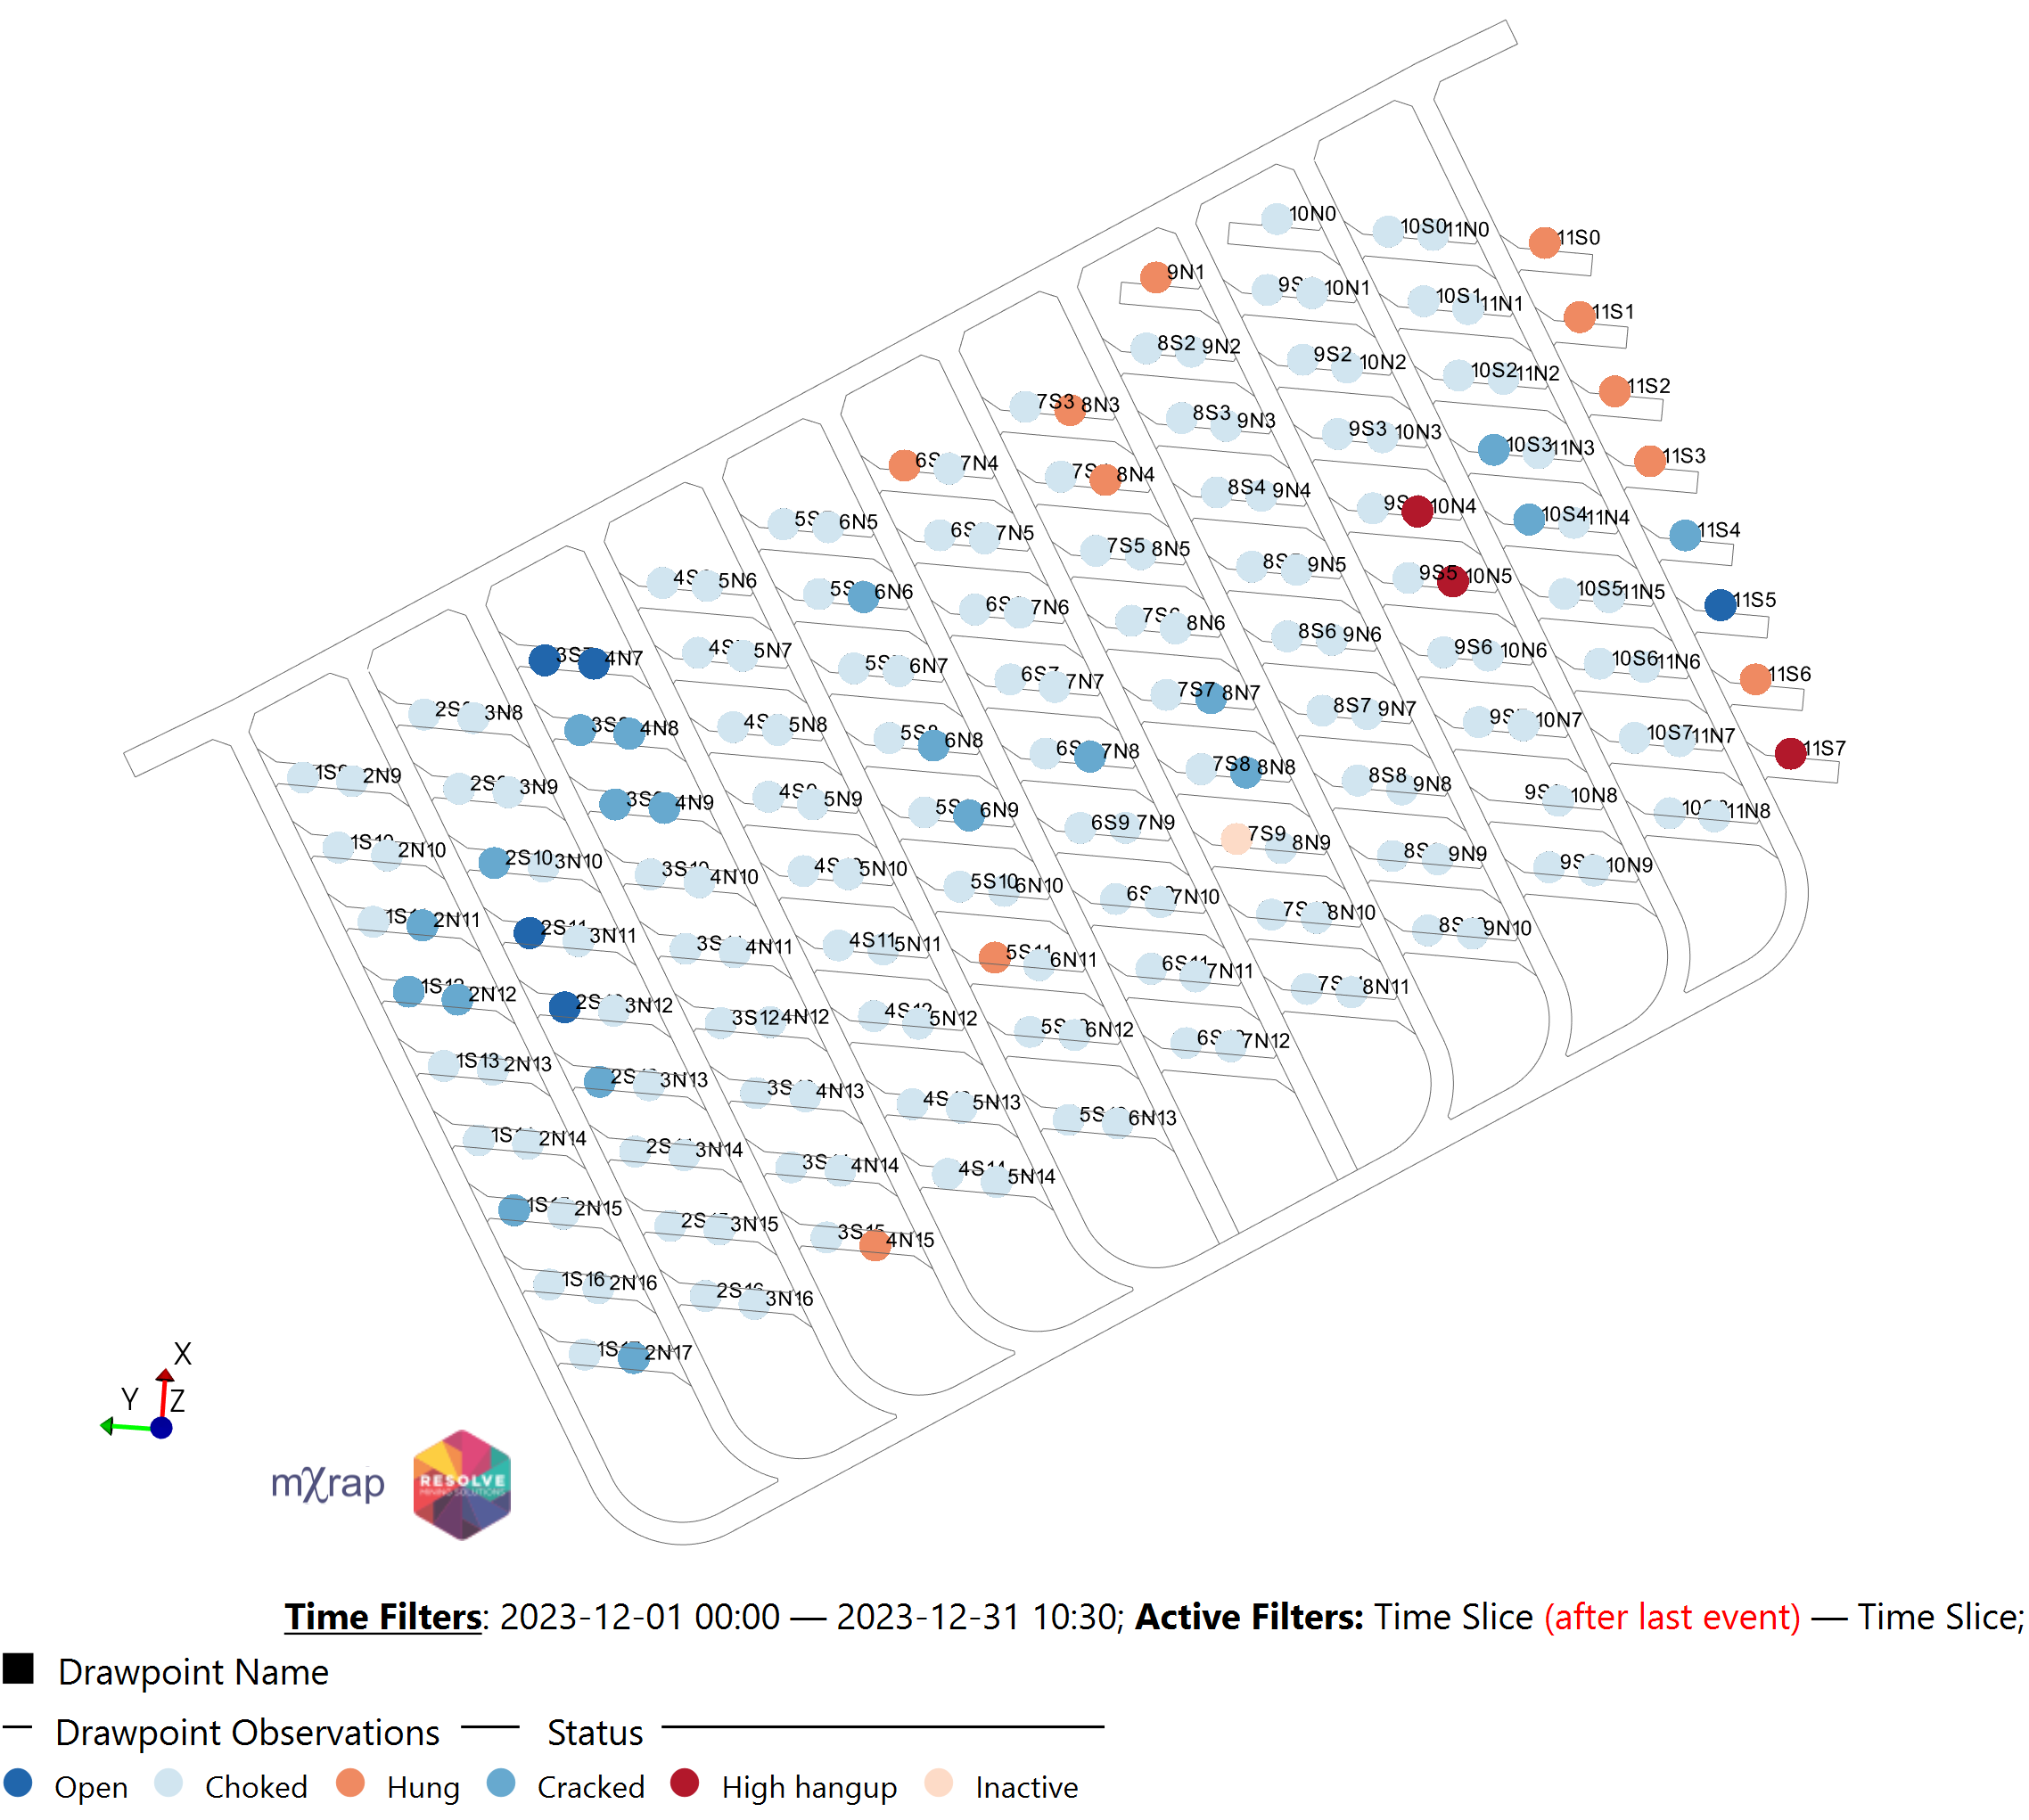
The observed drawpoint status is shown in Figure 4 and provides an easily accessible and readable plan of which drawpoints are open, choked, hung, or have high hangups. Whether it be for management's use for monitoring the level performance, or for assisting secondary breakers in prioritising their work, this tool has the potential to support safe operations across several areas.
Inrush Occurrence - learning from history.
Learning from history is something that is fundamental to understanding the future potential for re-occurrence. Figure 5, Figure 6 and Figure 7 visually show several reported features of an inrush event.
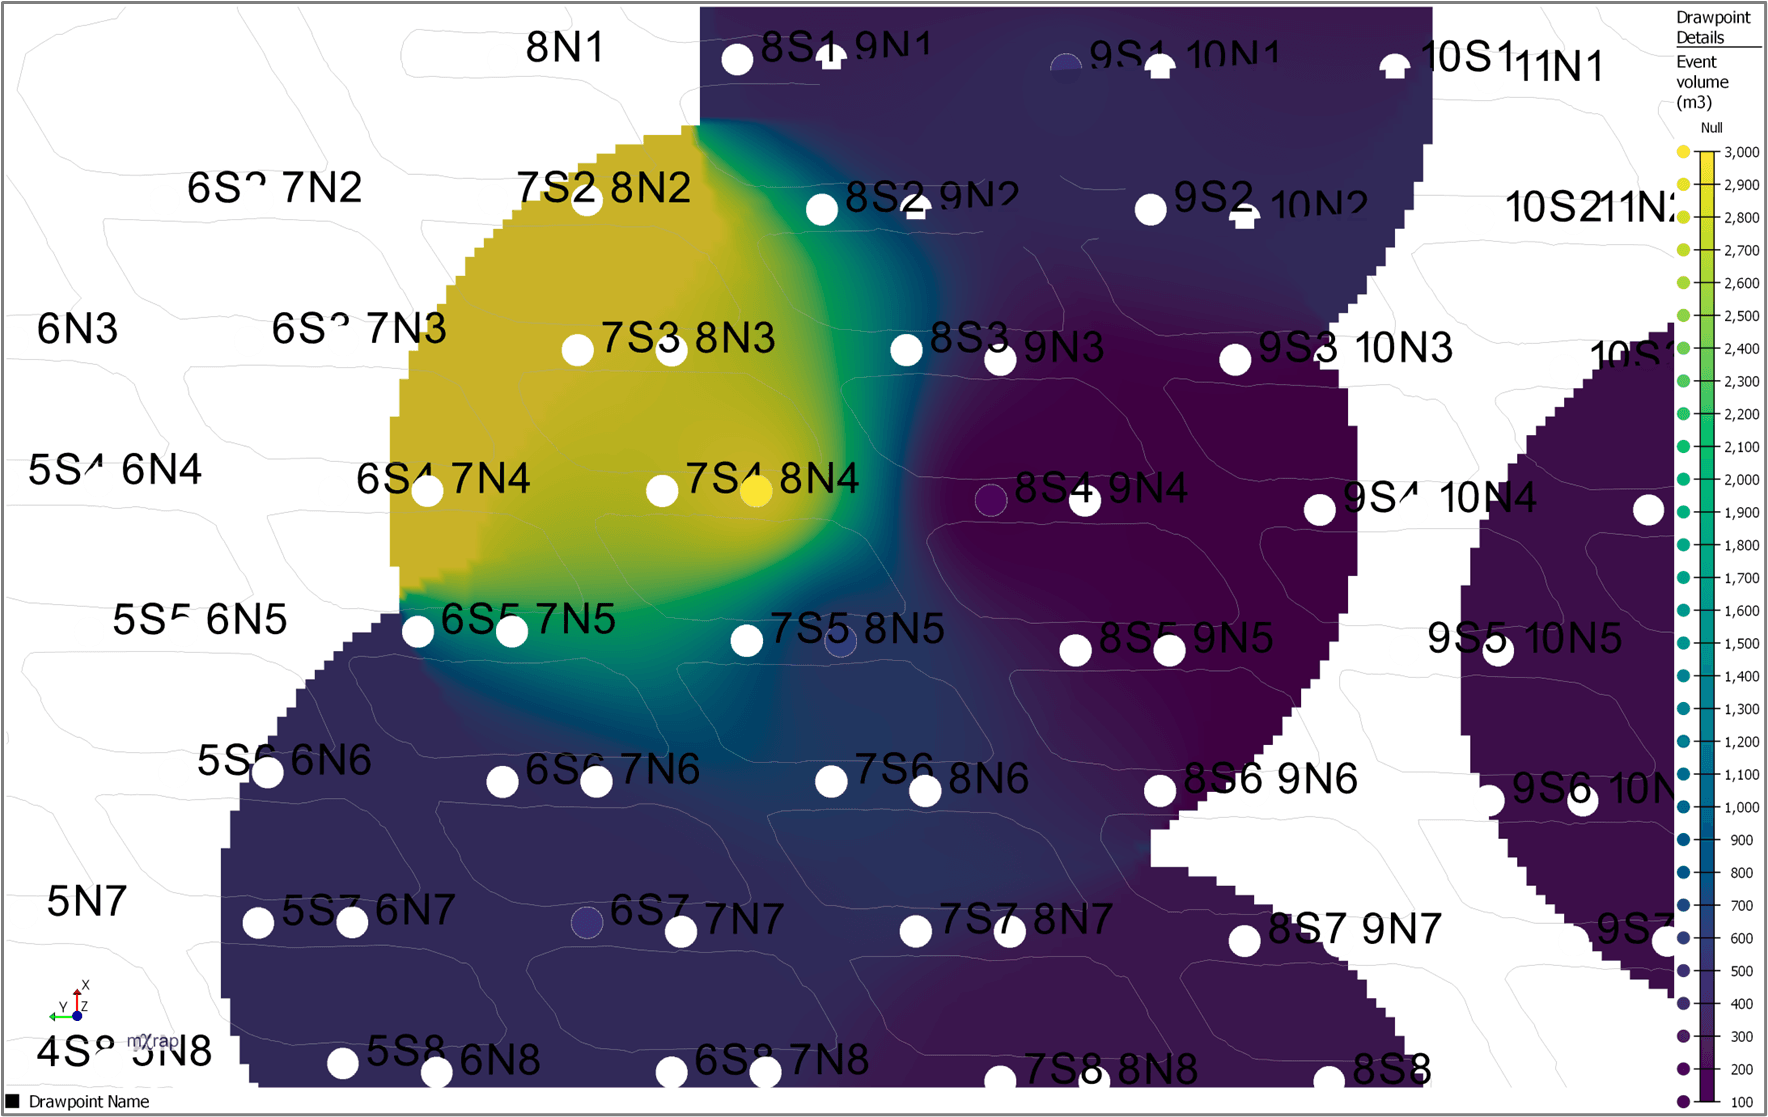
Volume
This represents the estimated, or surveyed, volume of an individual inrush event. The data is displayed as colour coded icons at each drawpoint, along with a heatmap to allow trend analyses in operations that experience inrush events on a frequent basis.
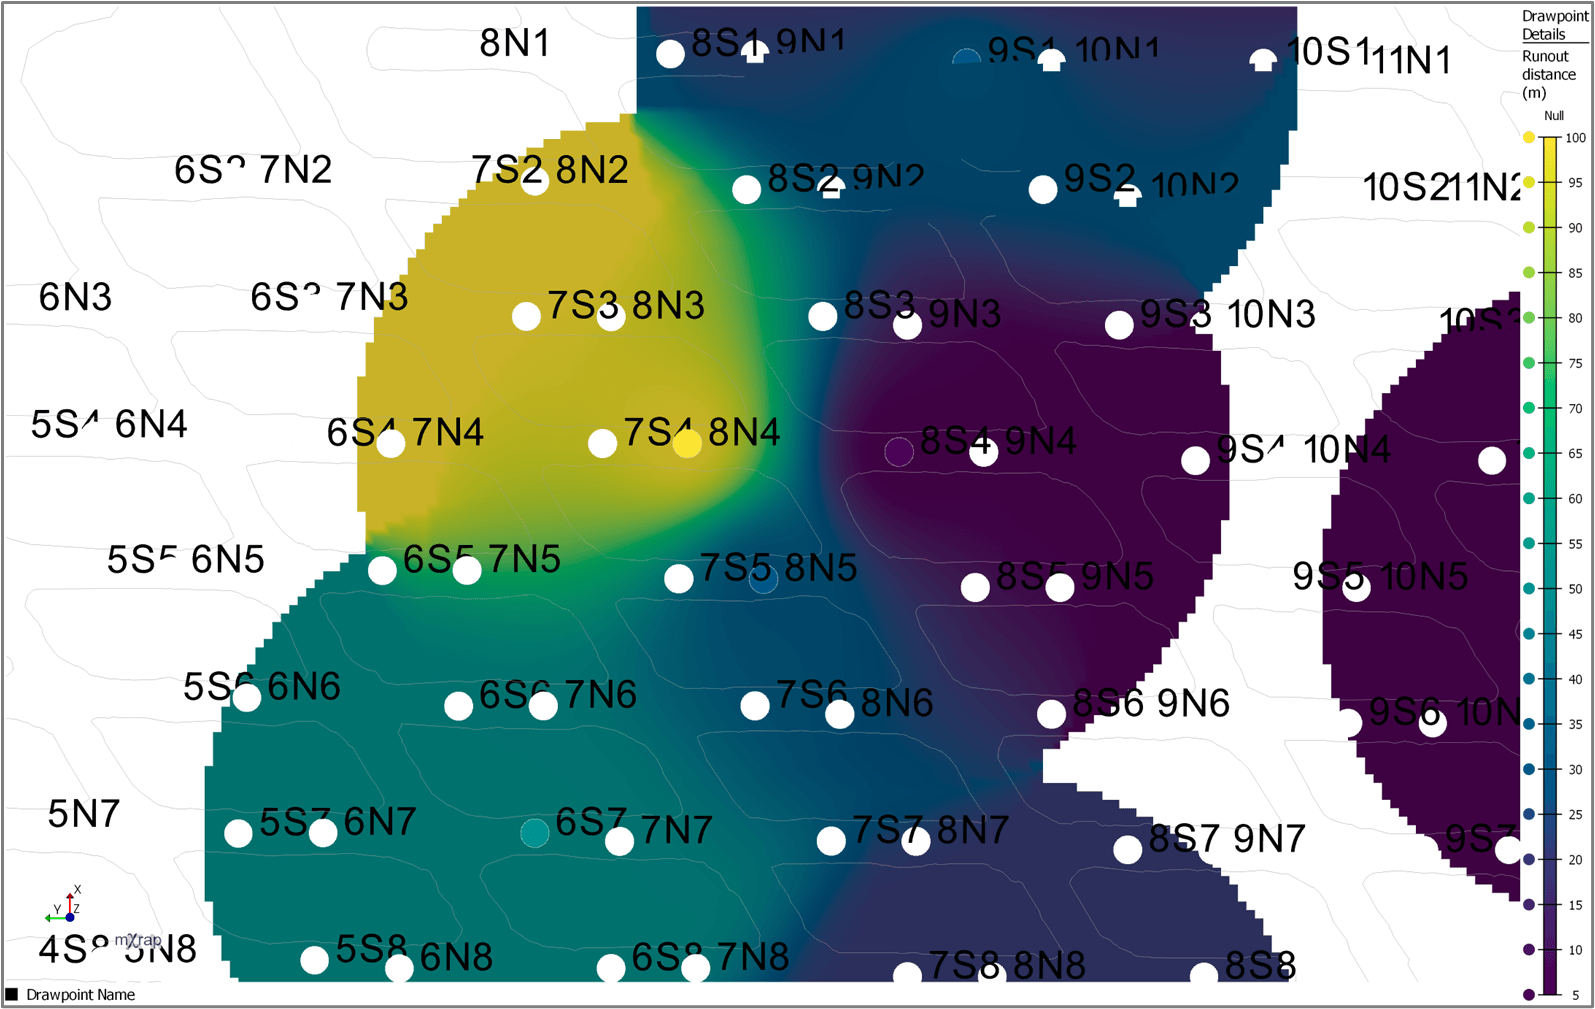
Runout distance
This is either an estimated or surveyed measure of the distance the inrush event travelled. As there are several influencing factors for this, it is another factor that requires additional investigation post event to identify pre-cursors to support risk management. Both coloured icons and a heat map are included to support the visualisation of the data for communication purposes.