Reporting for management & TARP triggers
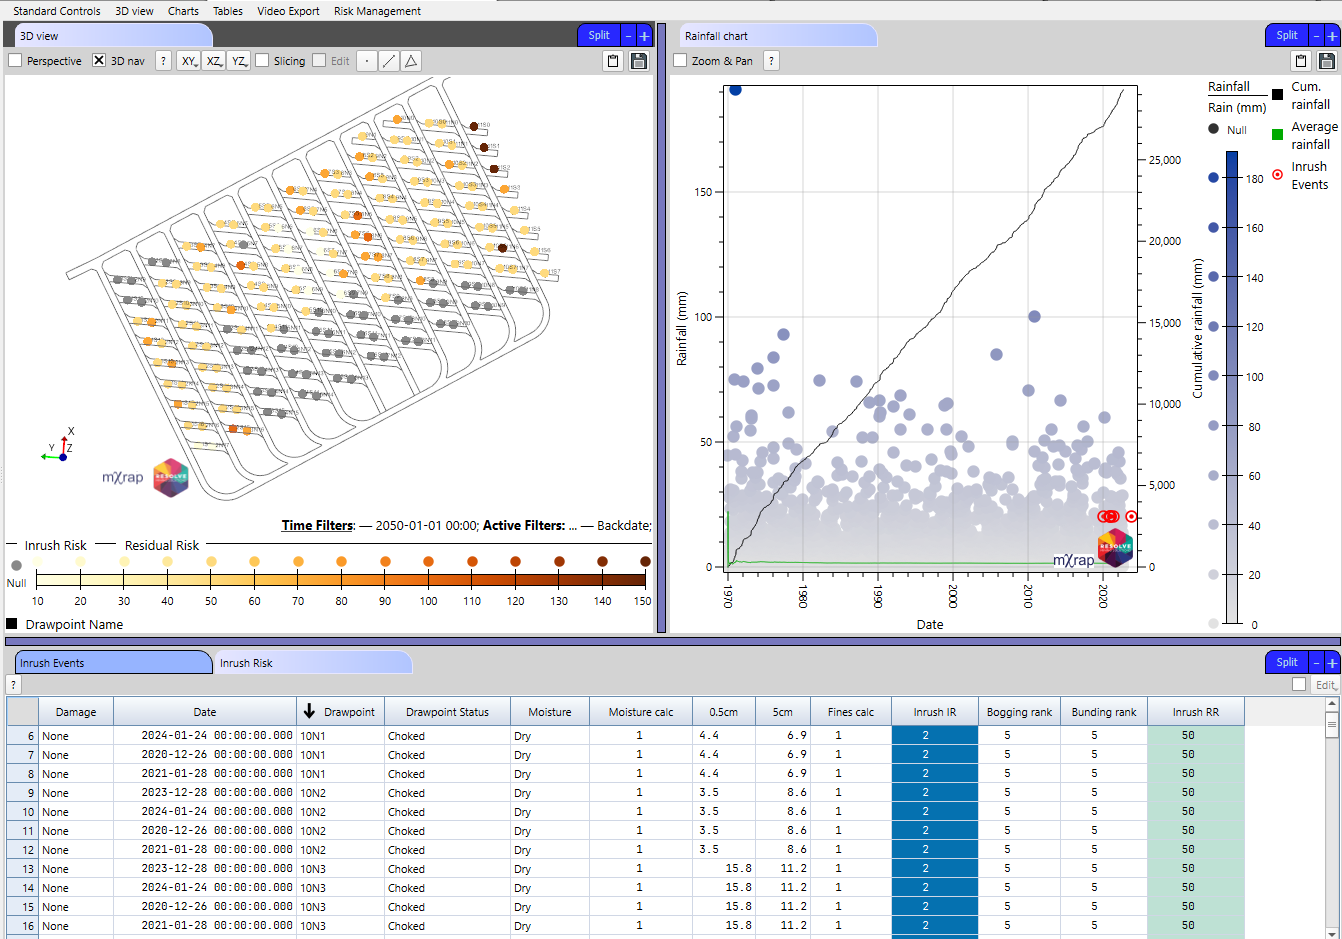
Streamlined reporting of data and transparency with management concerning risk exposure is key to ensuring effective operations are maintained, with data driven risk-based decisions being accessible at all levels of the business. Utilising a specific user profile implemented for the Inrush Management App, anyone with access to the app can view the Inrush Management App dashboard (Figure 12), utilise the time slicing features and turn layers on and off, without being able to change settings or data that defines the app.
Having easy access to data, with a simple interface requiring minimal training, facilitates the communication of operationally critical data without the need for extensive and time-consuming reports. In addition, where reports are required, the user is easily able to insert high-quality images directly from the mXrap app using the in-built copy-to-clipboard and save image features, which are present across the entire mXrap suite.
In addition to the dashboard reporting, the calculated inherent and residual risks associated with inrush (Figure 13) can be visualised and linked to operational TARPs. In the example shown, inherent risk is calculated as shown in Equation 1.
Equation 1 Calculation for Inherent Risk
Where:
- Fragmentation score ranked as per Table 1.
- Moisture score ranked as per Table 2.
This classification is an example only and should be customised to each site and their own systems.
| Category | Fragmentation descriptor | Score |
|---|---|---|
| Coarse | Material <5cm represents <30% of drawpoint fragmentation | 1 |
| Medium | Material <5cm represents 30% - 70% of drawpoint fragmentation | 2 |
| Fine | Material <5cm represents >70% of drawpoint fragmentation | 3 |
Table 1 Fragmentation classification for inrush risk calculation
| Category | Fragmentation descriptor | Score |
|---|---|---|
| Dry | No signs of moisture at the drawpoint | 1 |
| Damp | Moisture observed as touch and slight colour change / smell of moisture observed | 2 |
| Dripping | Visible signs of water observed as drips from material or flow control device | 3 |
| Flowing | Clear water is observed flowing from the drawpoint | 4 |
| Inflow | Muddy coloured water is observed flowing from the drawpoint | 5 |
Table 2 Moisture classification for inrush risk calculation
Once the inherent risk is calculated, the controls that are deemed required by the operation can then be multiplied out as shown in Equation 2.
Equation 2 Calculation for Residual Risk
Where Control 1 score ranked as per Table 3 and Control 2 score ranked as per Table 4
| Control 1 descriptor | Score |
|---|---|
| Bund in place | 1 |
| No bund in place | 5 |
Table 3 Control 1 classification - Bunding
| Control 2 descriptor | Score |
|---|---|
| Automation bogging | 1 |
| Manual bogging | 5 |
Table 4 Control 2 classification - Bogging method
As with the inherent risk calculation, the control factors can be customised to the site-specific requirements and are used as examples only in this demonstration.
| Inherent Risk | Residual Risk |
|---|---|
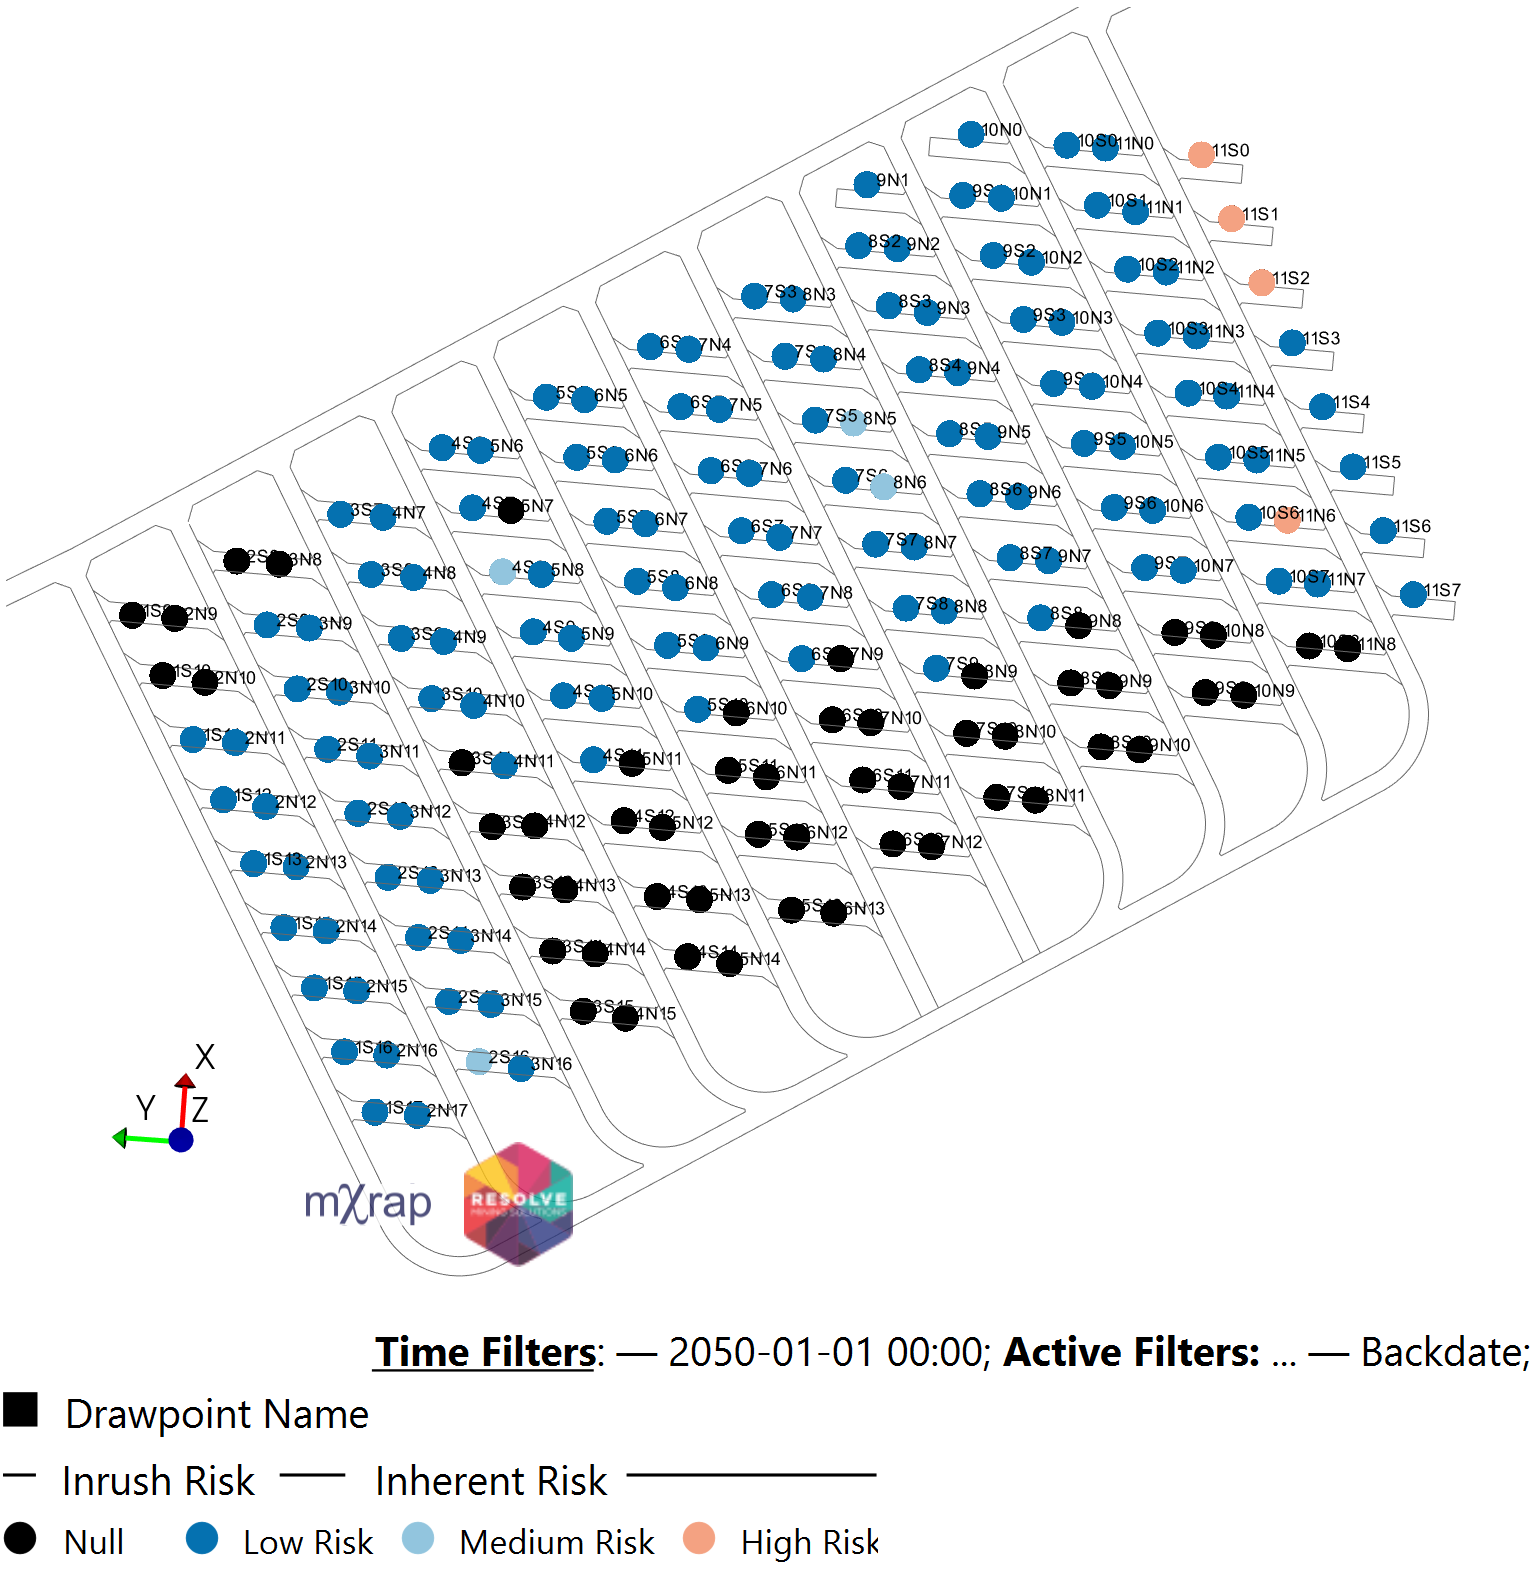 | 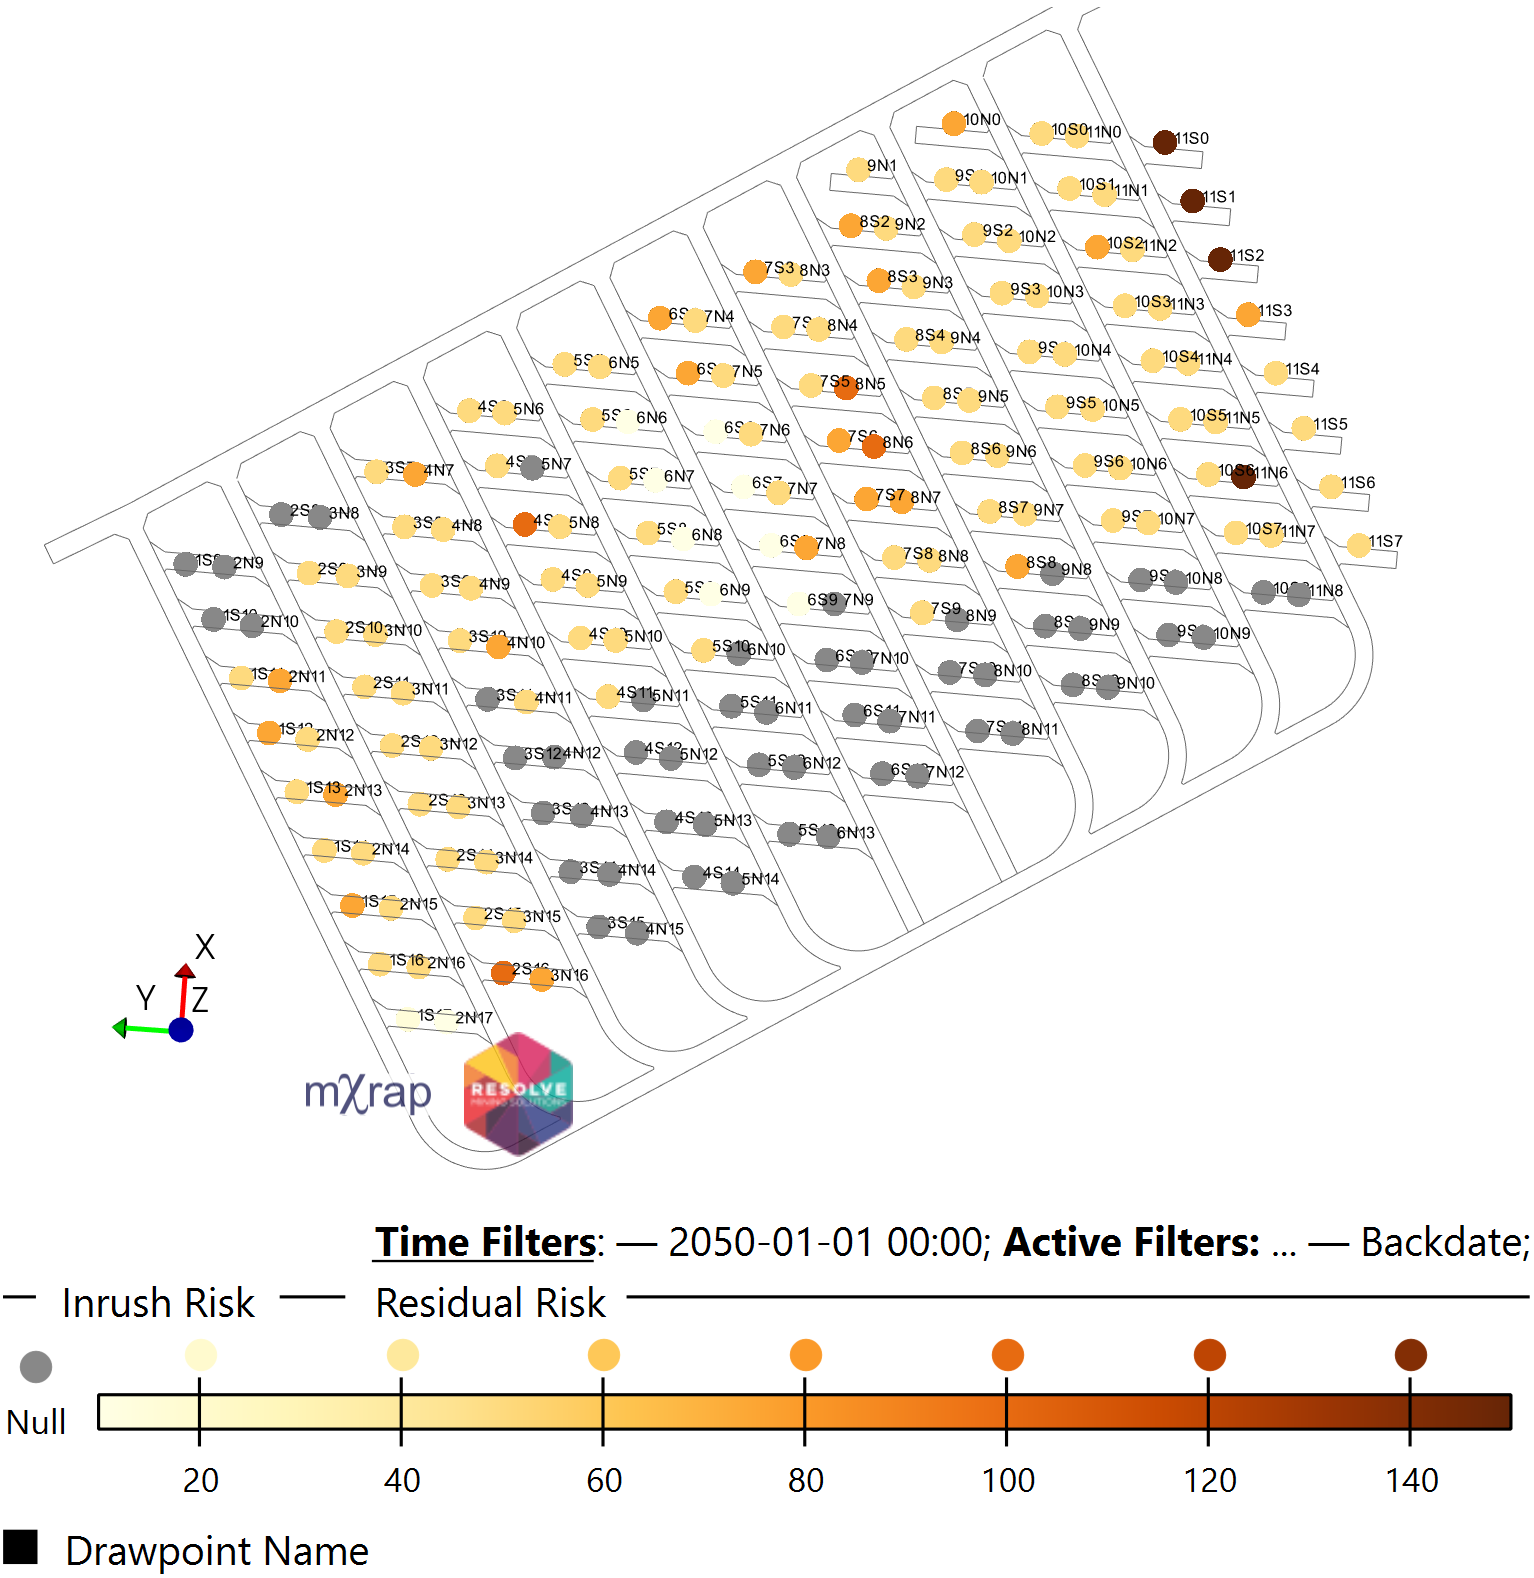 |
Figure 13 Inherent and Residual Risk