Hazard Setup
Grid Definition
The first step in setting up the hazard calculations is to specify the grid. You can choose from your list of grids. These can be edited in the Configurations area. An explanation for editing grids can be found here.
The grid spacing, minimum, and maximum can be overridden in the control panel. You can also move or stretch the saved grid. There is a limit to the number of grid points that can be generated within a grid. You can increase this limit if required.
Increasing the default grid cell limit may crash the application. Best to keep the limit to below 30 million (3e7).
Data Ranges
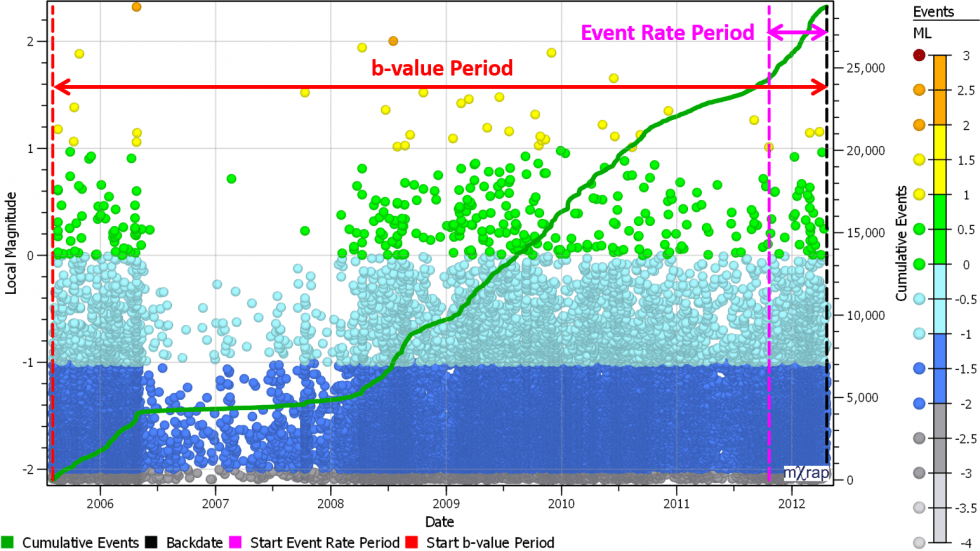
The next step is to define the date ranges for the events to be used in the hazard calculations. You can use the current date or set a backdate for the end of the event period. Then there are two time periods to specify: one for event rate calculations, and one for b-value calculations. Usually the date range for calculating b-value will be a lot longer than for calculating event rate. Use the chart to assess the date ranges for each parameter.
MUL
If you're not familiar with MUL, review the theory page for the definition and discussion MUL Explained. There are a number of methods used to calculate MUL listed in the table. The largest of the estimates is used by default. You can override the MUL if preferred.