Ground Motion Prediction Equation
You can plot the GMPE in a couple of different ways:
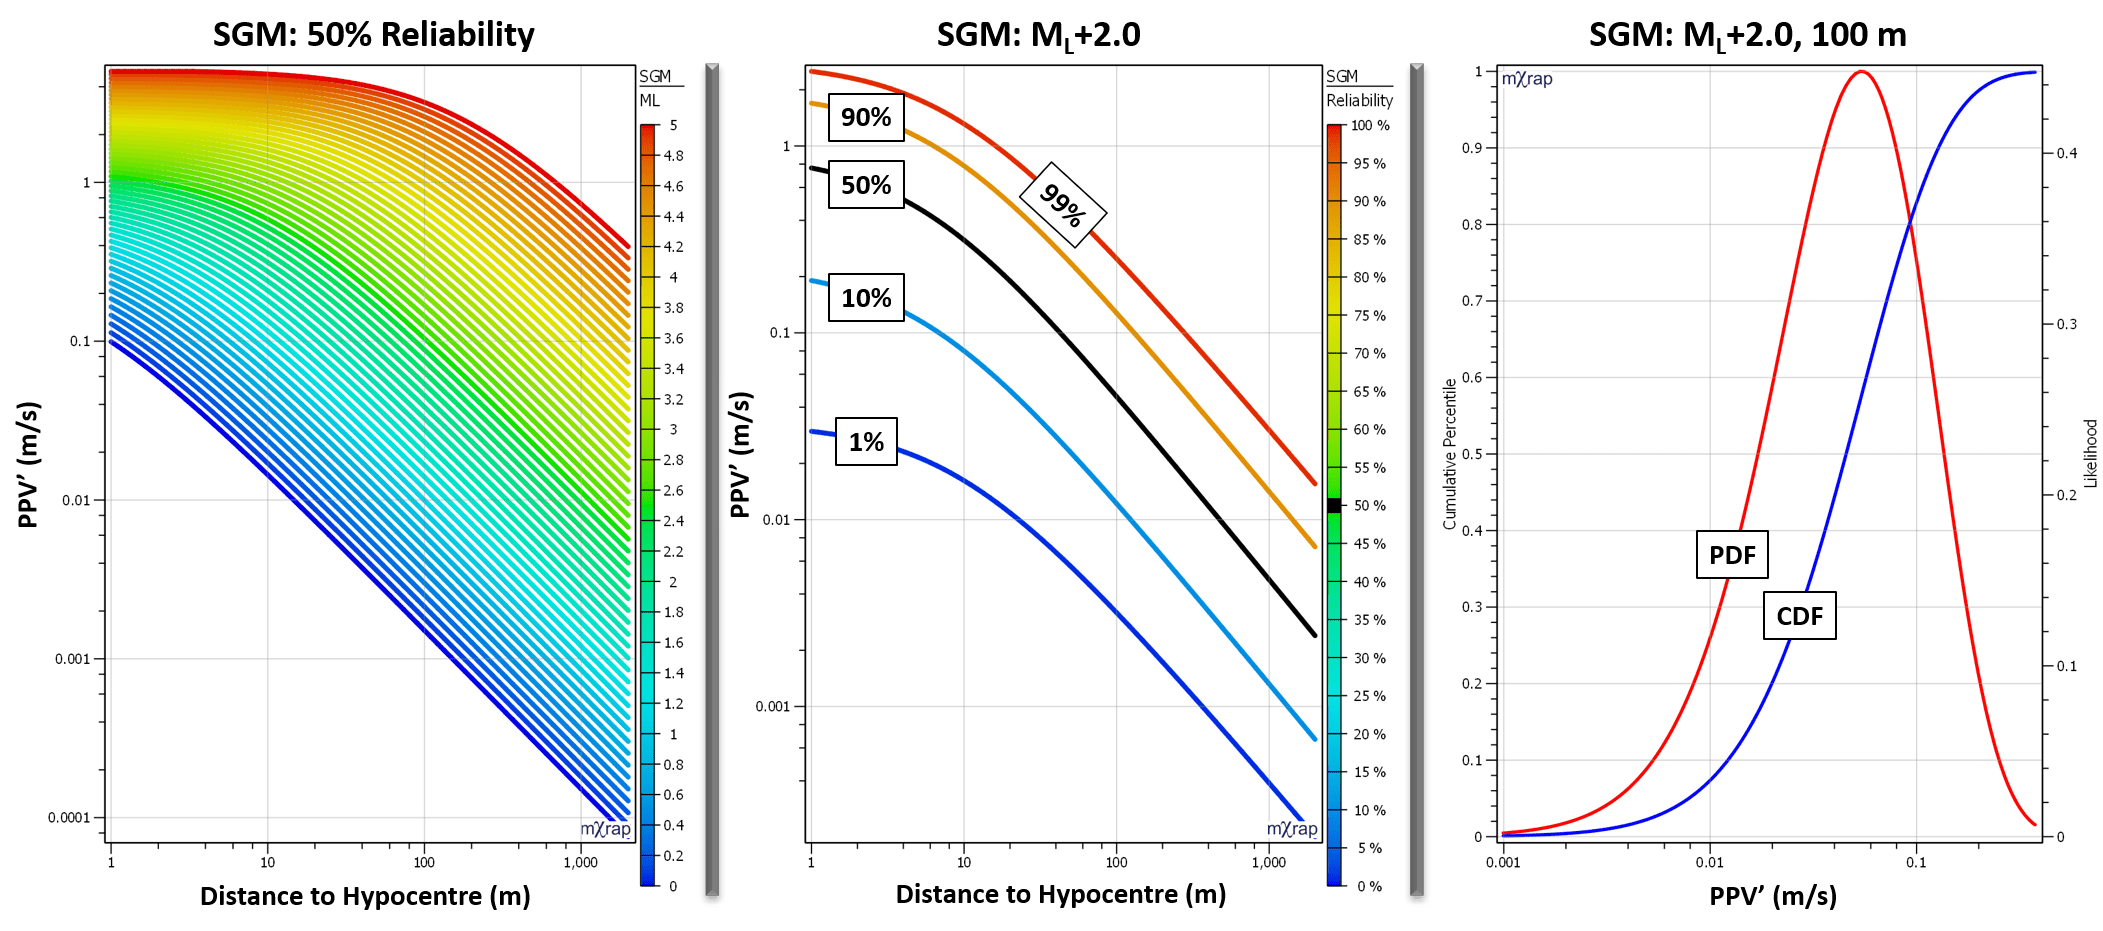
- Single Reliability (P) - This is the most traditional way of viewing the GMPE relationship. The PPV is plotted against the distance to hypocentre (R) for various magnitudes. This chart uses a single reliability / probability of non-exceedance. Adjust the reliability in the control panel. Note: Probability of exceedance = 1 - Reliability.
- Single ML - Plot PPV vs. R for various reliability levels (up to 4 levels plus the 50% line). Adjust the chosen ML from the control panel.
- Single ML, R - Plot the PDF and CDF for a particular ML and R combination. Adjust the chosen ML and R from the control panel.
For more information on the GMPE relationship, go to the following theory page: Ground Motion Prediction Theory