Sensitivity Assessment Window
This window is set up to conduct sensitivity analysis based on the trendline fit obtained in the previous window. It allows you to exclude current sensors and add planned sensors to see how the sensitivity changes across your mine.
Steps
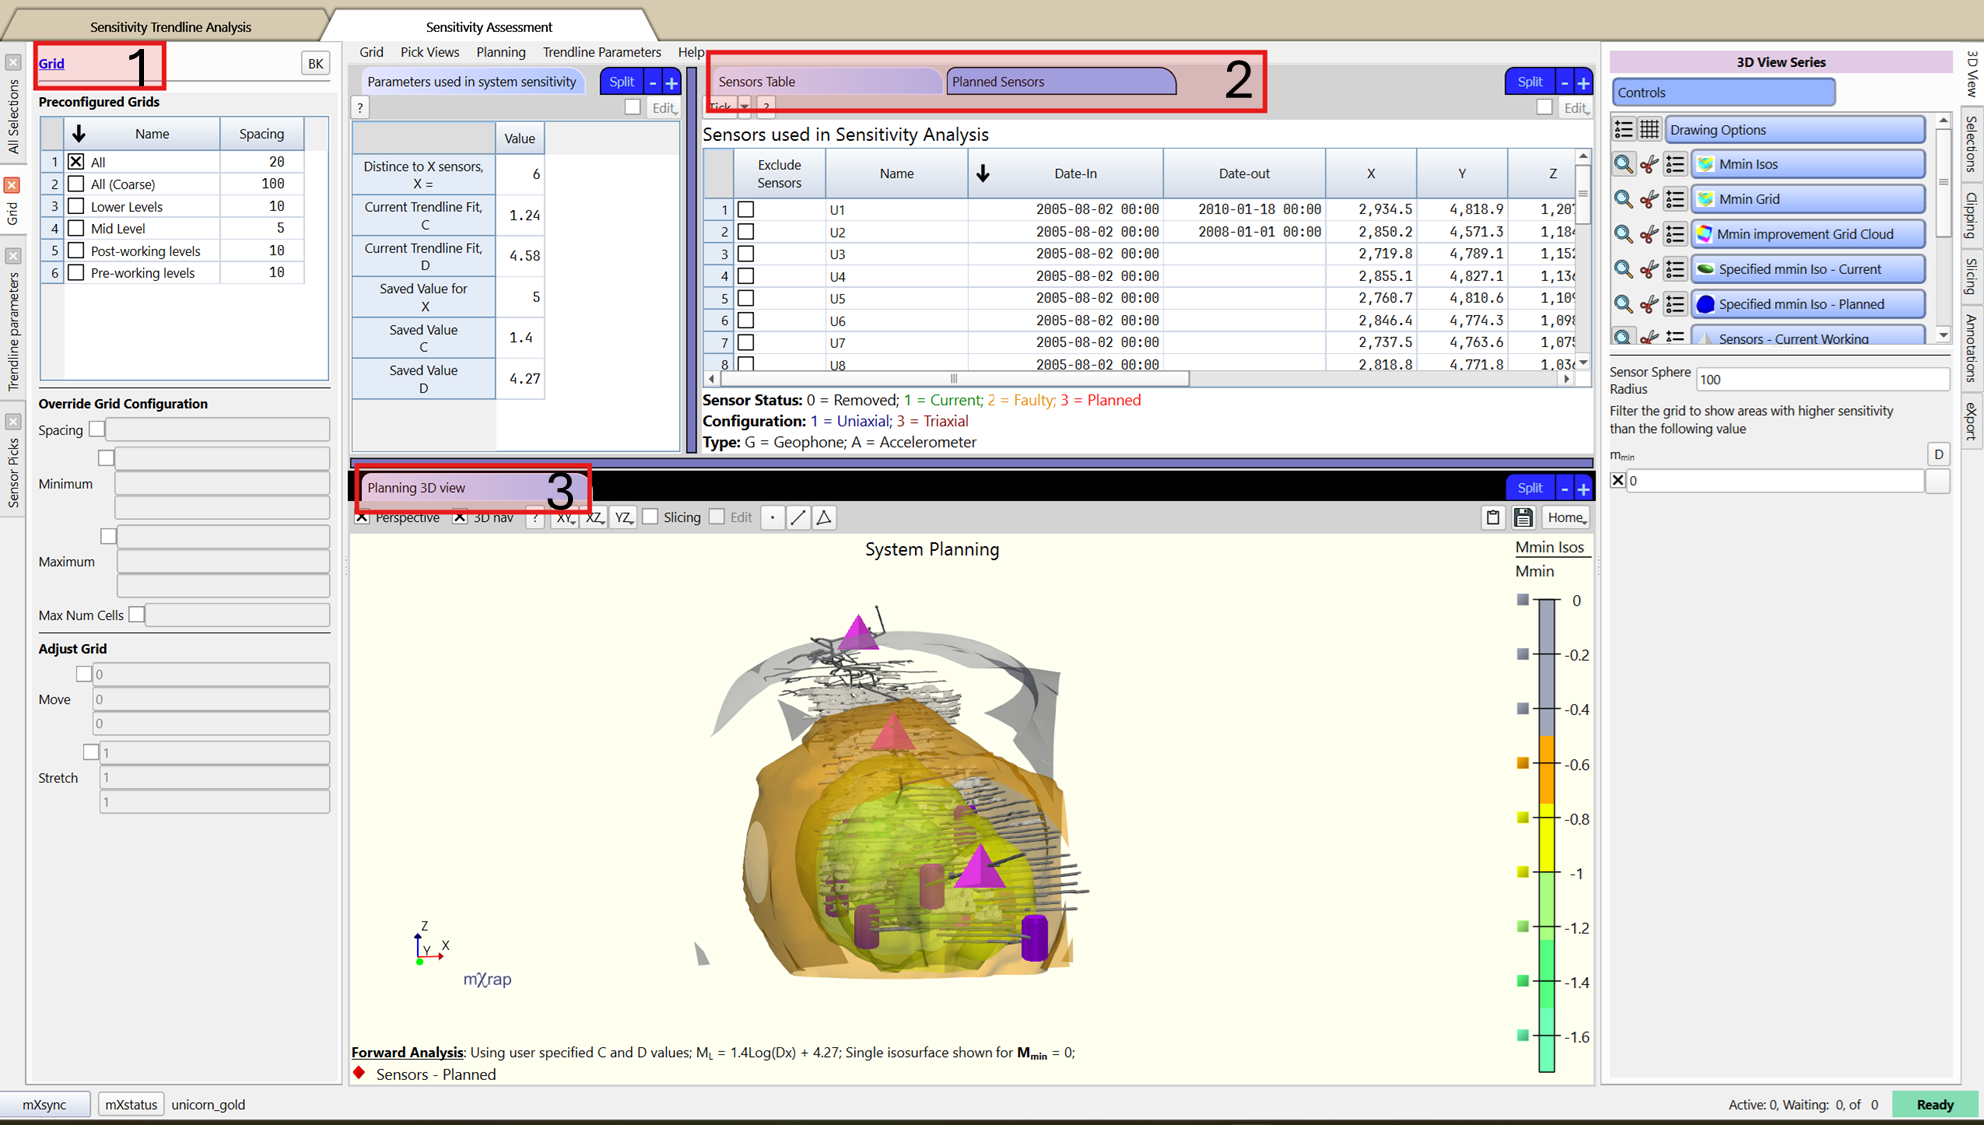
- Select your grid in the Grid panel on the left side.
- Select the sensors to exclude (Sensors Table) and planned sensors (Planned Sensors table) to include in your analysis. New sensors can be added in the Planned Sensors table by ticking the edit box, inserting a new row for your new sensor and inputting the required information.
- Visualise the results in the 3Dview. The is plotted using the grip points or ISO surfaces. The improvement can be plotted, as well as the different sensors (current vs planned) and specified ISO.
Additional tools in the window
There is a Trendline parameters panel as well as a Parameters used in system sensitivity table that allows to visualise the trendline fit and override the values if required.
There is a Sensor Pick panel that allows visualising sensor information based on the sensor picked in the 3D view using the F2 key.