Seismic Event Quality
Overview
Seismic data quality is often an overlooked component in the data analysis process. A bad seismic dataset will lead to inaccurate analyses and data interpretation. The data quality app provides several tools to assist in investigating possible data quality concerns. These tools include density analysis, consistency checks, potential blast detection, spatial filters and outlier detection.
Data Anomaly Detection
This window, located under the Data Quality Analyses section, is designed to help analyse your seismic event database and identify any anomalies in the frequency of readings for certain seismic parameters. Currently, the tool is focused on identifying issues with the S-Wave Corner Frequency and S-P Energy Ratio.
Anomalies often stem from default values, null entries, manual input or rounding mistakes. While many of these anomalies indicate bad data, not all do. However, if any data is found to be incorrect, it's important to clear these values to prevent skewing your analysis. The Anomaly Detection window provides visualisation tools to help you investigate any flagged anomalies and take appropriate action.
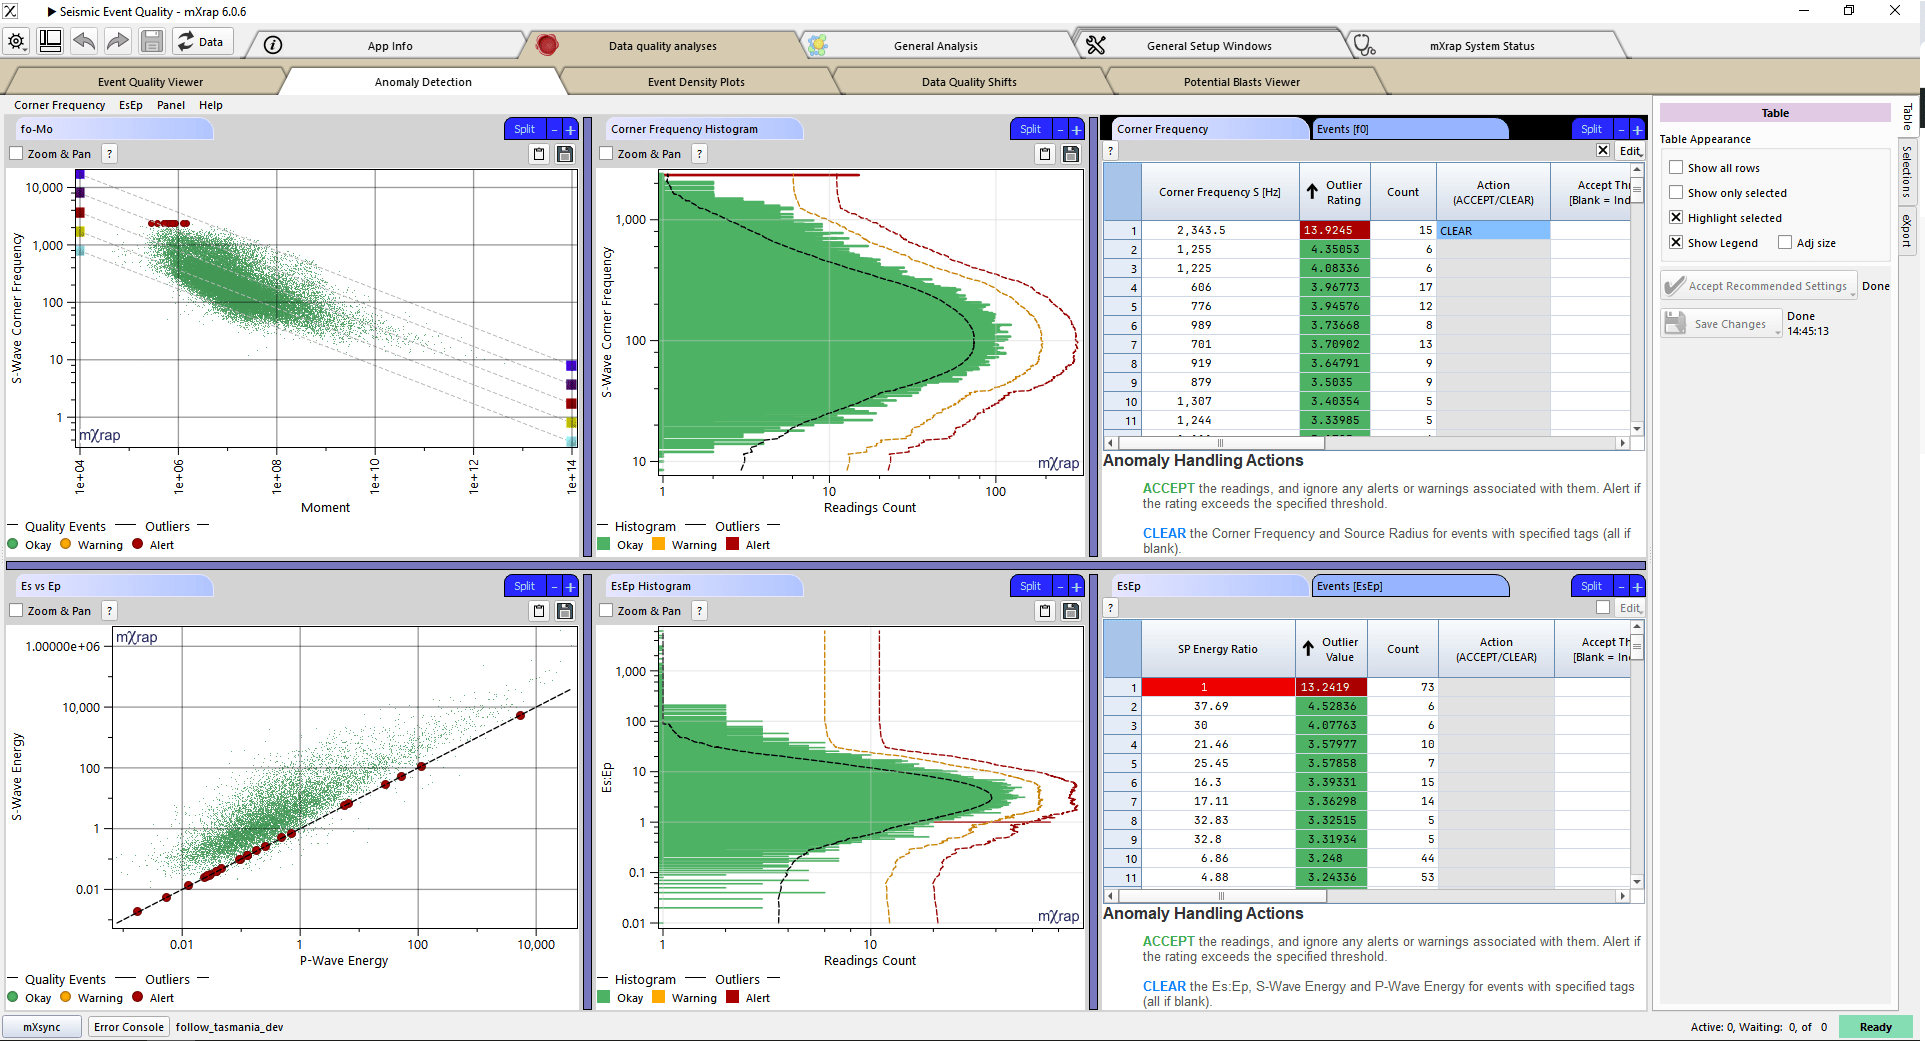
When an anomaly exceeds the alert threshold, you will receive an alert upon opening the Seismic Event Quality app. From there, you have the option to:
- Ignore the alert,
- Accept the recommended settings, or
- Open the Anomaly Detection window for further investigation.

The recommended settings will clear any flagged values from the database.
Within the Anomaly Detection window, you can choose to either ACCEPT or CLEAR the flagged readings:
- ACCEPT: Set a threshold for when the alert should re-trigger (optional).
- CLEAR: Specify which event tags the clearing applies to (optional).
When you choose to CLEAR, this will also clear any derived parameters associated with the source parameter.
For example:
- Clearing the S-Wave Corner Frequency will also clear the Source Radius.
- Clearing the S-P Energy Ratio will also clear the S-Wave Energy and P-Wave Energy.
Remember to click the "Save Changes" button on the right-hand side to save any modifications.
Events highlighted in orange indicate that they have exceeded the warning threshold but have not yet reached the alert threshold.
Technical Reading
-
Morkel, IG & Wesseloo, J 2017, 'A technique to determine systematic shifts in microseismic databases', in Proceedings of the Eighth International Conference on Deep and High Stress Mining, 2017, Australian Centre for Geomechanics. https://doi.org/10.36487/ACG_rep/1704_05_Morkel
-
Morkel, IG & Wesseloo, J 2017, 'The effect of sensor frequency range on the estimation of the current hazard state', in J.A. Vallejos (ed.), 9th International Symposium on Rockbursts and Seismicity in Mines, 15-17 November 2017, Santiago, Chile.
-
Morkel, IG, Wesseloo, J & Harris, PC 2015, 'Highlighting and quantifying seismic data quality concerns', in PM Dight (ed.), Ninth International Symposium on Field Measurements in Geomechanics, 9-11 September 2015, Sydney, New South Wales, Australia, Australian Centre for Geomechanics, pp. 215-222. https://doi.org/10.36487/ACG_rep/1508_37_Morkel